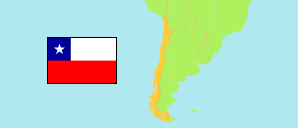
Coquimbo
Region in Chile
Contents: Subdivision
The population development in Coquimbo as well as related information and services (Wikipedia, Google, images).
| Name | Status | Population Estimate 2002-07-01 | Population Estimate 2007-07-01 | Population Estimate 2012-07-01 | Population Estimate 2017-07-01 | Population Projection 2023-07-01 | |
|---|---|---|---|---|---|---|---|
| Coquimbo | Region | 628,489 | 674,245 | 730,943 | 793,049 | 869,103 | |
| Choapa | Province | 83,267 | 85,151 | 88,346 | 92,039 | 96,424 | → |
| Elqui | Province | 382,843 | 422,946 | 470,387 | 521,954 | 585,664 | → |
| Limarí | Province | 162,379 | 166,148 | 172,210 | 179,056 | 187,015 | → |
| Chile | Republic | 15,691,701 | 16,517,933 | 17,443,491 | 18,419,192 | 19,960,889 |
Source: Instituto Nacional de Estadísticas.
Explanation: All tabulated population figures consider the results of the 2017 census.
Further information about the population structure:
| Gender (P 2023) | |
|---|---|
| Males | 425,400 |
| Females | 443,703 |
| Age Groups (P 2023) | |
|---|---|
| 0-17 years | 205,425 |
| 18-64 years | 540,835 |
| 65+ years | 122,843 |
| Age Distribution (P 2023) | |
|---|---|
| 80+ years | 30,324 |
| 70-79 years | 52,571 |
| 60-69 years | 85,960 |
| 50-59 years | 106,772 |
| 40-49 years | 115,344 |
| 30-39 years | 130,087 |
| 20-29 years | 120,842 |
| 10-19 years | 118,662 |
| 0-9 years | 108,541 |
| Urbanization (C 2017) | |
|---|---|
| Rural | 142,470 |
| Urban | 615,116 |
| Country of Birth (C 2017) | |
|---|---|
| Chile | 742,848 |
| South America | 11,124 |
| Central America & Caribbean | 1,423 |
| North America | 311 |
| Europe | 1,341 |
| Other country & undeclared | 539 |