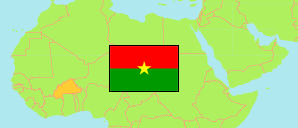
Nord
Region in Burkina Faso
Contents: Subdivision
The population development in Nord as well as related information and services (Wikipedia, Google, images).
| Name | Status | Population Census 1985-12-10 | Population Census 1996-12-10 | Population Census 2006-12-09 | Population Census 2019-11-16 | Population Projection 2024-07-01 | |
|---|---|---|---|---|---|---|---|
| Nord | Region | 760,408 | 955,420 | 1,185,796 | 1,722,115 | 1,939,319 | |
| Loroum | Province | 82,773 | 111,339 | 142,853 | 198,192 | 223,119 | → |
| Passoré | Province | 223,830 | 271,864 | 323,222 | 457,930 | 512,043 | → |
| Yatenga | Province | 353,669 | 444,563 | 553,164 | 825,975 | 932,556 | → |
| Zondoma | Province | 100,136 | 127,654 | 166,557 | 240,018 | 271,601 | → |
| Burkina Faso | Republic | 7,964,705 | 10,312,609 | 14,017,262 | 20,505,155 | 23,409,015 |
Source: Institut National de la Statistique et de la Demographie, Burkina Faso (web).
Explanation: The figures for 2019 are final. Due to the security situation during the 2019 census, population figures for 7 communes in Burkina Faso were completely estimated and counts were enhanced by estimates in the case of 31 communes. 313 Burkinabè communes were fully counted.
Further information about the population structure:
| Gender (P 2024) | |
|---|---|
| Males | 913,456 |
| Females | 1,025,863 |
| Age Groups (P 2024) | |
|---|---|
| 0-14 years | 943,817 |
| 15-64 years | 928,546 |
| 65+ years | 66,956 |
| Age Distribution (P 2024) | |
|---|---|
| 80+ years | 11,492 |
| 70-79 years | 30,673 |
| 60-69 years | 57,036 |
| 50-59 years | 87,291 |
| 40-49 years | 133,793 |
| 30-39 years | 190,445 |
| 20-29 years | 275,316 |
| 10-19 years | 482,398 |
| 0-9 years | 670,875 |
| Urbanization (C 2019) | |
|---|---|
| Rural | 1,470,467 |
| Urban | 251,648 |