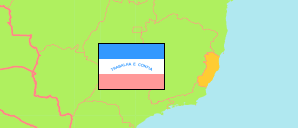
State
The population development of the State of Espírito Santo according to census results.
| Name | Abbr. | Status | Capital | Area A (km²) | Population Census (Cf) 1991-09-01 | Population Census (Cf) 2000-08-01 | Population Census (Cf) 2010-08-01 | Population Census (C) 2022-08-01 | ||
|---|---|---|---|---|---|---|---|---|---|---|
| Espírito Santo | ES | FSt | Vitória | 46,074 | 2,600,618 | 3,097,232 | 3,514,952 | 3,833,712 | 4607400 | → |
| Brazil | BRA | Fed Rep | Brasília | 8,510,418 | 146,825,475 | 169,799,170 | 190,755,799 | 203,080,756 |
- Instituto Brasileiro de Geografia e Estatistica.
Major Cities
| Name | Population Calculation (UE-E) 2021-07-01 | |
|---|---|---|
| 1 | Serra | 533,070 |
| 2 | Vila Velha | 506,190 |
| 3 | Cariacica | 374,200 |
| 4 | Vitória | 369,530 |
| 5 | Cachoeiro de Itapemirim | 193,960 |
| 6 | Linhares | 154,650 |
| 7 | Guarapari | 122,700 |
| 8 | Colatina | 109,390 |
| 9 | São Mateus | 104,390 |
Contents: Cities & Towns
The population of all cities and towns in the State of Espírito Santo with more than 20,000 inhabitants according to census results and latest calculations.
The urban population of the corresponding municipality is tabulated.
| Name | Population Census (Cf) 1991-09-01 | Population Census (Cf) 2000-08-01 | Population Census (Cf) 2010-08-01 | Population Calculation (UE-E) 2021-07-01 | Area | |
|---|---|---|---|---|---|---|
| Alegre | 16,330 | 19,741 | 21,512 | 20,880 | 0 | → |
| Anchieta | 8,793 | 13,211 | 18,161 | 23,010 | 0 | → |
| Aracruz | 43,030 | 54,458 | 71,451 | 91,630 | 0 | → |
| Baixo Guandu | 17,342 | 19,676 | 22,512 | 24,200 | 0 | → |
| Barra de São Francisco | 16,333 | 20,656 | 26,357 | 29,370 | 0 | → |
| Cachoeiro de Itapemirim | 117,119 | 155,401 | 173,589 | 193,960 | 0 | → |
| Cariacica | 261,084 | 312,980 | 337,643 | 374,200 | 0 | → |
| Castelo | 13,465 | 17,549 | 21,817 | 23,830 | 0 | → |
| Colatina | ... | 83,800 | 98,395 | 109,390 | 0 | → |
| Conceição da Barra | 15,514 | 19,319 | 22,575 | 24,980 | 0 | → |
| Guaçuí | 15,863 | 19,192 | 22,401 | 25,230 | 0 | → |
| Guarapari | 55,196 | 82,589 | 100,528 | 122,700 | 0 | → |
| Itapemirim | ... | 16,133 | 19,330 | 21,810 | 0 | → |
| Linhares | 86,005 | 92,917 | 121,567 | 154,650 | 0 | → |
| Marataízes | ... | 23,757 | 27,614 | 31,750 | 0 | → |
| Nova Venécia | 22,887 | 27,390 | 30,831 | 33,990 | 0 | → |
| Pedro Canário | 19,218 | 20,192 | 22,053 | 24,630 | 0 | → |
| Pinheiros | 14,039 | 13,970 | 18,718 | 21,620 | 0 | → |
| Piúma | 8,562 | 14,101 | 17,449 | 21,560 | 0 | → |
| São Gabriel da Palha | 17,055 | 18,365 | 24,325 | 29,840 | 0 | → |
| São Mateus | 51,190 | 69,004 | 84,541 | 104,390 | 0 | → |
| Serra | 220,615 | 319,621 | 406,450 | 533,070 | 0 | → |
| Sooretama | ... | 11,419 | 16,873 | 22,130 | 0 | → |
| Viana | 39,888 | 49,597 | 59,632 | 74,070 | 0 | → |
| Vila Velha | 264,236 | 344,625 | 412,575 | 506,190 | 0 | → |
| Vitória | 258,777 | 292,304 | 327,801 | 369,530 | 0 | → |
- The urban population for 2021 is calculated by »City Population« using the urban population according to the 2010 census and latest official population estimates for the total municipality.
- Instituto Brasileiro de Geografia e Estatistica.
Population Structure
Further information about the population structure.
| Gender (C 2022) | |
|---|---|
| Males | 1,870,063 |
| Females | 1,963,649 |
| Age Groups (C 2022) | |
|---|---|
| 0-14 years | 741,496 |
| 15-64 years | 2,661,233 |
| 65+ years | 430,983 |
| Age Distribution (C 2022) | |
|---|---|
| 90+ years | 15,710 |
| 80-89 years | 72,180 |
| 70-79 years | 181,305 |
| 60-69 years | 362,203 |
| 50-59 years | 467,592 |
| 40-49 years | 576,351 |
| 30-39 years | 605,389 |
| 20-29 years | 555,457 |
| 10-19 years | 502,680 |
| 0-9 years | 494,845 |
| Ethnic Group (C 2022) | |
|---|---|
| Indigenous | 14,410 |
| Non-Indigenous | 3,819,302 |
| Color (C 2022) | |
|---|---|
| Black | 429,680 |
| White | 1,479,275 |
| Mixed / Other | 1,924,688 |
| Literacy (A15+) (C 2022) | |
|---|---|
| yes | 2,918,368 |
| no | 173,848 |
