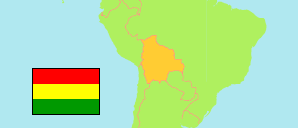
Potosí
Department in Bolivia
Contents: Subdivision
The population development in Potosí as well as related information and services (Wikipedia, Google, images).
| Name | Status | Population Projection 2012-07-01 | Population Projection 2020-07-01 | |
|---|---|---|---|---|
| Potosí | Department | 847,536 | 901,555 | |
| Alonso de Ibáñez | Province | 29,191 | 27,621 | → |
| Antonio Quijarro | Province | 56,323 | 67,218 | → |
| Bernardino Bilbao Rioja | Province | 10,643 | 10,196 | → |
| Charcas | Province | 42,000 | 42,806 | → |
| Chayanta | Province | 101,159 | 103,119 | → |
| Cornelio Saavedra | Province | 57,423 | 53,307 | → |
| Daniel Campos | Province | 5,985 | 6,742 | → |
| Enrique Baldivieso | Province | 1,730 | 1,712 | → |
| José María Linares | Province | 51,339 | 48,053 | → |
| Modesto Omiste | Province | 45,798 | 50,004 | → |
| Nor Chichas | Province | 43,560 | 44,420 | → |
| Nor Lípez | Province | 14,334 | 17,266 | → |
| Rafael Bustillo | Province | 89,293 | 94,297 | → |
| Sur Chichas (Sud Chichas) | Province | 57,293 | 61,134 | → |
| Sur Lípez | Province | 6,956 | 8,606 | → |
| Tomás Frías | Province | 234,509 | 265,054 | → |
| Bolivia | Plurinational State | 10,351,118 | 11,633,371 |
Source: Instituto Nacional de Estadística de Bolivia (web).
Further information about the population structure:
| Gender (C 2012) | |
|---|---|
| Males | 410,822 |
| Females | 417,271 |
| Age Groups (C 2012) | |
|---|---|
| 0-14 years | 285,682 |
| 15-64 years | 479,765 |
| 65+ years | 62,646 |
| Age Distribution (C 2012) | |
|---|---|
| 0-9 years | 187,812 |
| 10-19 years | 183,234 |
| 20-29 years | 127,513 |
| 30-39 years | 100,982 |
| 40-49 years | 77,119 |
| 50-59 years | 62,358 |
| 60-69 years | 46,597 |
| 70-79 years | 25,872 |
| 80+ years | 16,606 |
| Urbanization (C 2012) | |
|---|---|
| Rural | 491,681 |
| Urban | 336,412 |
| Literacy (A15+) (C 2012) | |
|---|---|
| yes | 478,454 |
| no | 63,957 |