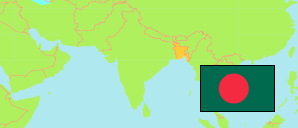
Nabinagar
Subdistrict in Bangladesh
Contents: Population
The population development of Nabinagar as well as related information and services (Wikipedia, Google, images).
| Name | Status | Transcription | Native | Population Census 1991-03-13 | Population Census 2001-01-22 | Population Census 2011-03-15 | Population Census 2022-06-14 | |
|---|---|---|---|---|---|---|---|---|
| Nabinagar | Subdistrict | Nabīnagara | নবীনগর উপজেলা | 393,959 | 420,383 | 493,518 | 555,839 | |
| Bangladesh | People's Republic | Bā̃lādēśa | বাংলাদেশ | 106,314,992 | 124,355,263 | 144,043,697 | 165,158,616 |
Source: Bangladesh Bureau of Statistics.
Explanation: The tabulated figures are not adjusted for underenumeration. Some area figures are derived from geospatial data.
Further information about the population structure:
| Gender (C 2022) | |
|---|---|
| Males | 251,011 |
| Females | 304,796 |
| Hijra | 32 |
| Age Groups (C 2022) | |
|---|---|
| 0-14 years | 202,794 |
| 15-64 years | 318,652 |
| 65+ years | 34,361 |
| Age Distribution (C 2022) | |
|---|---|
| 90+ years | 2,000 |
| 80-89 years | 4,675 |
| 70-79 years | 14,838 |
| 60-69 years | 31,145 |
| 50-59 years | 38,925 |
| 40-49 years | 47,822 |
| 30-39 years | 67,064 |
| 20-29 years | 85,993 |
| 10-19 years | 128,026 |
| 0-9 years | 135,319 |
| Urbanization (C 2022) | |
|---|---|
| Rural | 448,816 |
| Urban | 107,023 |
| Religion (C 2022) | |
|---|---|
| Muslims | 517,798 |
| Hindus | 37,979 |
| Buddhists | 14 |
| Christians | 14 |
| Other Religion | 2 |