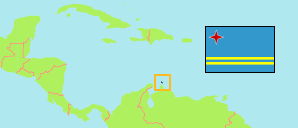
Klip / Mon Plaisir
Zone in Aruba
Contents: Population
The population development of Klip / Mon Plaisir as well as related information and services (Wikipedia, Google, images).
| Name | Status | Population Census 2000-10-01 | Population Census 2010-09-29 | Population Census 2020-10-01 | |
|---|---|---|---|---|---|
| Klip / Mon Plaisir | Zone | 1,554 | 1,377 | 1,393 | |
| Aruba | Country | 90,506 | 101,484 | 108,166 |
Source: Central Bureau of Statistics Aruba (web).
Explanation: The 2020 total includes 115 persons who are assigned to no region and no zone. Area figures of zones are computed by using geospatial data.
Further information about the population structure:
| Gender (C 2020) | |
|---|---|
| Males | 609 |
| Females | 784 |
| Age Groups (C 2020) | |
|---|---|
| 0-14 years | 145 |
| 15-64 years | 854 |
| 65+ years | 394 |
| Country of Birth (C 2020) | |
|---|---|
| Aruba | 707 |
| Other country | 671 |
| Language at Home (C 2010) | |
|---|---|
| Papiamento | 743 |
| Spanish | 308 |
| Dutch | 203 |
| English | 87 |
| Chinese | 2 |
| Other language | 11 |
| Religion (C 2010) | |
|---|---|
| Roman Catholic | 922 |
| Protestant (reformed) | 148 |
| Jehova's witness | 5 |
| Methodist | 9 |
| Adventist | 5 |
| Anglican | 9 |
| Jewish | 24 |
| Other religion | 137 |
| No religion | 103 |