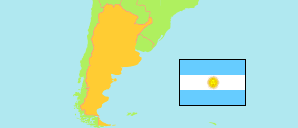
Santiago del Estero
Province in Argentina
Contents: Subdivision
The population development in Santiago del Estero as well as related information and services (Wikipedia, Google, images).
| Name | Status | Population Census 1991-05-15 | Population Census 2001-11-17 | Population Census 2010-10-27 | Population Census 2022-05-18 | |
|---|---|---|---|---|---|---|
| Santiago del Estero | Province | 671,988 | 804,457 | 874,006 | 1,060,906 | |
| Aguirre | Department | 5,936 | 7,035 | 7,610 | 8,970 | → |
| Alberdi | Department | 10,633 | 15,617 | 17,252 | 20,104 | → |
| Atamisqui | Department | 9,251 | 9,809 | 10,923 | 14,903 | → |
| Avellaneda | Department | 18,239 | 19,348 | 20,763 | 25,476 | → |
| Banda | Department | 104,287 | 128,387 | 142,279 | 170,651 | → |
| Belgrano | Department | 5,909 | 7,950 | 9,243 | 10,813 | → |
| Capital | Department | 201,894 | 244,567 | 267,125 | 330,112 | → |
| Choya | Department | 30,691 | 33,720 | 34,667 | 43,736 | → |
| Copo | Department | 19,220 | 26,984 | 31,404 | 35,741 | → |
| Figueroa | Department | 16,040 | 17,495 | 17,820 | 20,270 | → |
| General Taboada | Department | 29,400 | 36,683 | 38,105 | 46,508 | → |
| Guasayán | Department | 6,882 | 7,404 | 7,602 | 9,255 | → |
| Jiménez | Department | 12,324 | 13,170 | 14,352 | 18,625 | → |
| Juan Felipe Ibarra | Department | 14,351 | 16,937 | 18,051 | 20,589 | → |
| Loreto | Department | 14,904 | 17,442 | 20,036 | 24,060 | → |
| Mitre | Department | 1,894 | 1,813 | 1,890 | 1,440 | → |
| Moreno | Department | 21,746 | 28,053 | 32,130 | 40,460 | → |
| Ojo de Agua | Department | 11,818 | 13,352 | 14,008 | 15,116 | → |
| Pellegrini | Department | 16,061 | 19,517 | 20,514 | 26,193 | → |
| Quebrachos | Department | 9,475 | 11,331 | 10,568 | 12,354 | → |
| Río Hondo | Department | 45,051 | 50,781 | 54,867 | 66,761 | → |
| Rivadavia | Department | 4,763 | 4,916 | 5,015 | 5,315 | → |
| Robles | Department | 32,567 | 40,060 | 44,415 | 54,015 | → |
| Salavina | Department | 9,100 | 10,664 | 11,217 | 12,787 | → |
| San Martín | Department | 8,555 | 9,148 | 9,831 | 11,848 | → |
| Sarmiento | Department | 4,149 | 4,669 | 4,607 | 5,038 | → |
| Silípica | Department | 6,848 | 7,605 | 7,712 | 9,766 | → |
| Argentina | Republic | 32,615,528 | 36,260,130 | 40,117,096 | 45,892,285 |
Source: Instituto Nacional de Estadística y Censos de la Republica Argentina.
Explanation: The results of the 2022 census are final.
Further information about the population structure:
| Gender (C 2022) | |
|---|---|
| Males | 521,543 |
| Females | 539,363 |
| Age Groups (C 2022) | |
|---|---|
| 0-14 years | 269,201 |
| 15-64 years | 695,737 |
| 65+ years | 95,913 |
| Age Distribution (C 2022) | |
|---|---|
| 90+ years | 3,247 |
| 80-89 years | 16,304 |
| 70-79 years | 42,739 |
| 60-69 years | 72,273 |
| 50-59 years | 91,960 |
| 40-49 years | 135,048 |
| 30-39 years | 152,790 |
| 20-29 years | 184,737 |
| 10-19 years | 187,718 |
| 0-9 years | 174,035 |