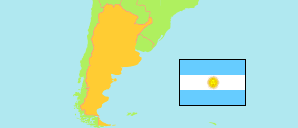
San Juan
Province in Argentina
Contents: Subdivision
The population development in San Juan as well as related information and services (Wikipedia, Google, images).
| Name | Status | Population Census 1991-05-15 | Population Census 2001-11-17 | Population Census 2010-10-27 | Population Census 2022-05-18 | |
|---|---|---|---|---|---|---|
| San Juan | Province | 528,715 | 620,023 | 681,055 | 822,853 | |
| Albardón | Department | 16,645 | 20,413 | 23,888 | 31,284 | → |
| Angaco | Department | 7,323 | 7,570 | 8,125 | 10,176 | → |
| Calingasta | Department | 7,667 | 8,176 | 8,588 | 11,034 | → |
| Capital | Department | 119,423 | 112,778 | 109,123 | 115,390 | → |
| Caucete | Department | 28,159 | 33,609 | 38,343 | 44,047 | → |
| Chimbas | Department | 52,263 | 73,829 | 87,258 | 105,627 | → |
| Iglesia | Department | 5,626 | 6,737 | 9,099 | 8,845 | → |
| Jáchal | Department | 19,955 | 21,018 | 21,730 | 25,297 | → |
| Nueve de Julio (9 de Julio) | Department | 5,972 | 7,652 | 9,307 | 12,514 | → |
| Pocito | Department | 30,597 | 40,969 | 53,162 | 72,915 | → |
| Rawson | Department | 90,174 | 107,740 | 114,368 | 136,617 | → |
| Rivadavia | Department | 56,986 | 76,150 | 82,641 | 101,666 | → |
| San Martín | Department | 9,154 | 10,140 | 11,115 | 15,037 | → |
| Santa Lucía | Department | 38,086 | 43,565 | 48,087 | 62,729 | → |
| Sarmiento | Department | 15,932 | 19,092 | 22,131 | 27,188 | → |
| Ullum | Department | 3,173 | 4,490 | 4,886 | 6,454 | → |
| Valle Fértil | Department | 5,633 | 6,864 | 7,222 | 8,526 | → |
| Veinticinco de Mayo (25 de Mayo) | Department | 13,042 | 15,193 | 17,119 | 20,824 | → |
| Zonda | Department | 2,905 | 4,038 | 4,863 | 6,683 | → |
| Argentina | Republic | 32,615,528 | 36,260,130 | 40,117,096 | 45,892,285 |
Source: Instituto Nacional de Estadística y Censos de la Republica Argentina.
Explanation: The results of the 2022 census are final.
Further information about the population structure:
| Gender (C 2022) | |
|---|---|
| Males | 401,201 |
| Females | 421,652 |
| Age Groups (C 2022) | |
|---|---|
| 0-14 years | 202,530 |
| 15-64 years | 531,664 |
| 65+ years | 88,608 |
| Age Distribution (C 2022) | |
|---|---|
| 90+ years | 2,718 |
| 80-89 years | 15,018 |
| 70-79 years | 41,686 |
| 60-69 years | 61,637 |
| 50-59 years | 76,892 |
| 40-49 years | 105,807 |
| 30-39 years | 115,012 |
| 20-29 years | 131,358 |
| 10-19 years | 140,705 |
| 0-9 years | 131,969 |