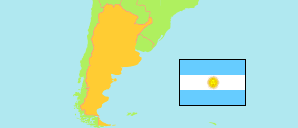
La Rioja
Province in Argentina
Contents: Subdivision
The population development in La Rioja as well as related information and services (Wikipedia, Google, images).
| Name | Status | Population Census 1991-05-15 | Population Census 2001-11-17 | Population Census 2010-10-27 | Population Census 2022-05-18 | |
|---|---|---|---|---|---|---|
| La Rioja | Province | 220,729 | 289,983 | 333,642 | 383,865 | |
| Ángel Vicente Peñaloza | Department | 2,848 | 3,127 | 3,073 | 3,185 | → |
| Arauco | Department | 11,173 | 13,720 | 15,418 | 16,257 | → |
| Capital | Department | 105,996 | 146,411 | 180,995 | 211,651 | → |
| Castro Barros | Department | 3,265 | 4,322 | 4,268 | 5,810 | → |
| Chamical | Department | 10,723 | 13,383 | 14,160 | 15,666 | → |
| Chilecito | Department | 31,616 | 42,248 | 49,432 | 58,798 | → |
| Famatina | Department | 5,302 | 6,371 | 5,863 | 7,002 | → |
| General Belgrano | Department | 5,848 | 7,161 | 7,370 | 7,618 | → |
| General Felipe Varela | Department | 8,214 | 9,939 | 9,648 | 11,372 | → |
| General Juan Facundo Quiroga | Department | 3,738 | 4,546 | 4,108 | 4,017 | → |
| General Lamadrid | Department | 1,430 | 1,717 | 1,734 | 1,886 | → |
| General Ortiz de Ocampo | Department | 6,496 | 7,331 | 7,145 | 7,349 | → |
| General San Martín | Department | 3,934 | 4,956 | 4,944 | 5,019 | → |
| Independencia | Department | 2,174 | 2,405 | 2,427 | 2,401 | → |
| Rosario Vera Peñaloza | Department | 10,852 | 13,299 | 14,054 | 15,783 | → |
| Sanagasta | Department | 1,668 | 2,165 | 2,345 | 3,038 | → |
| San Blas de los Sauces | Department | 3,145 | 4,048 | 3,927 | 4,314 | → |
| Vinchina | Department | 2,307 | 2,834 | 2,731 | 2,699 | → |
| Argentina | Republic | 32,615,528 | 36,260,130 | 40,117,096 | 45,892,285 |
Source: Instituto Nacional de Estadística y Censos de la Republica Argentina.
Explanation: The results of the 2022 census are final.
Further information about the population structure:
| Gender (C 2022) | |
|---|---|
| Males | 187,348 |
| Females | 196,517 |
| Age Groups (C 2022) | |
|---|---|
| 0-14 years | 84,765 |
| 15-64 years | 264,174 |
| 65+ years | 34,912 |
| Age Distribution (C 2022) | |
|---|---|
| 90+ years | 1,174 |
| 80-89 years | 5,562 |
| 70-79 years | 15,647 |
| 60-69 years | 27,654 |
| 50-59 years | 36,729 |
| 40-49 years | 52,217 |
| 30-39 years | 58,301 |
| 20-29 years | 69,400 |
| 10-19 years | 62,979 |
| 0-9 years | 54,188 |