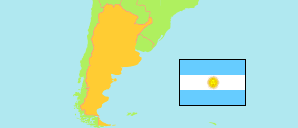
Formosa
Province in Argentina
Contents: Subdivision
The population development in Formosa as well as related information and services (Wikipedia, Google, images).
| Name | Status | Population Census 1991-05-15 | Population Census 2001-11-17 | Population Census 2010-10-27 | Population Census 2022-05-18 | |
|---|---|---|---|---|---|---|
| Formosa | Province | 398,413 | 486,559 | 530,162 | 607,419 | |
| Bermejo | Department | 10,143 | 12,710 | 14,046 | 15,644 | → |
| Formosa | Department | 159,545 | 210,071 | 234,354 | 269,589 | → |
| Laishi | Department | 13,581 | 16,227 | 17,063 | 19,303 | → |
| Matacos | Department | 8,355 | 12,133 | 14,375 | 17,032 | → |
| Patiño | Department | 58,472 | 64,830 | 68,581 | 81,819 | → |
| Pilagás | Department | 17,378 | 17,523 | 18,399 | 19,116 | → |
| Pilcomayo | Department | 67,012 | 78,114 | 85,024 | 94,383 | → |
| Pirané | Department | 57,277 | 64,023 | 64,566 | 72,804 | → |
| Ramón Lista | Department | 6,650 | 10,928 | 13,754 | 17,729 | → |
| Argentina | Republic | 32,615,528 | 36,260,130 | 40,117,096 | 45,892,285 |
Source: Instituto Nacional de Estadística y Censos de la Republica Argentina.
Explanation: The results of the 2022 census are final.
Further information about the population structure:
| Gender (C 2022) | |
|---|---|
| Males | 296,810 |
| Females | 310,609 |
| Age Groups (C 2022) | |
|---|---|
| 0-14 years | 153,098 |
| 15-64 years | 398,067 |
| 65+ years | 56,254 |
| Age Distribution (C 2022) | |
|---|---|
| 90+ years | 1,719 |
| 80-89 years | 9,022 |
| 70-79 years | 24,992 |
| 60-69 years | 44,815 |
| 50-59 years | 57,695 |
| 40-49 years | 74,325 |
| 30-39 years | 87,273 |
| 20-29 years | 102,175 |
| 10-19 years | 106,384 |
| 0-9 years | 99,019 |