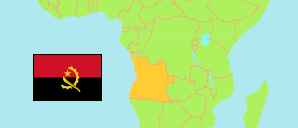
Namibe
Province in Angola
Contents: Subdivision
The population development in Namibe as well as related information and services (Wikipedia, Google, images).
| Name | Status | Population Census 2014-05-16 | Population Projection 2022-07-01 | |
|---|---|---|---|---|
| Namibe | Province | 495,326 | 650,500 | |
| Bibala | Municipality | 64,504 | 84,695 | → |
| Camucuio | Municipality | 50,349 | 66,112 | → |
| Namibe | Municipality | 292,535 | 384,199 | → |
| Tômbwa (Porto Alexandre) | Municipality | 55,494 | 72,887 | → |
| Virei | Municipality | 32,445 | 42,607 | → |
| Angola | Republic | 25,789,024 | 33,086,278 |
Source: Instituto Nacional de Estatística, República de Angola (web).
Explanation: Area figures of municipalities are derived from imprecise geometries.
Further information about the population structure:
| Gender (P 2022) | |
|---|---|
| Males | 317,364 |
| Females | 333,136 |
| Age Groups (C 2014) | |
|---|---|
| 0-14 years | 238,763 |
| 15-64 years | 246,207 |
| 65+ years | 10,357 |
| Age Distribution (C 2014) | |
|---|---|
| 0-9 years | 175,584 |
| 10-19 years | 114,890 |
| 20-29 years | 84,597 |
| 30-39 years | 50,753 |
| 40-49 years | 32,617 |
| 50-59 years | 21,077 |
| 60-69 years | 8,831 |
| 70-79 years | 4,284 |
| 80+ years | 2,692 |
| Urbanization (C 2014) | |
|---|---|
| Rural | 179,670 |
| Urban | 315,656 |
| Literacy (A15+) (C 2014) | |
|---|---|
| yes | 164,980 |
| no | 91,584 |
| Spoken Language(s) (C 2014) | |
|---|---|
| Portuguese | 310,941 |
| Umbundu | 92,520 |
| Kimbundu | 4,028 |
| Kikongo | 3,522 |
| Chokwe | 2,357 |
| Nganguela | 5,550 |
| Nhaneca | 54,686 |
| Fiote/Ibinda | 2,764 |
| Cuanhama | 2,446 |
| Luvale | 11,019 |
| Muhumbi | 51,292 |
| Other language | 32,625 |
| Deaf-mute | 449 |
| Religion (C 2014) | |
|---|---|
| Catholic | 201,297 |
| Protestant | 141,010 |
| Indigenous religion | 280 |
| Muslim | 252 |
| Jew | 800 |
| Other religion | 11,962 |
| No religion | 139,725 |