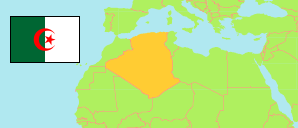
Mila
Province in Algeria
Contents: Subdivision
The population development in Mila as well as related information and services (Wikipedia, Google, images).
| Name | Status | Native | Population Census 1998-06-25 | Population Census 2008-04-14 | |
|---|---|---|---|---|---|
| Mila | Province | ميلة | 674,480 | 766,886 | |
| Ahmed Rachedi | Commune | أحمد راشد | 14,489 | 15,819 | → |
| Aïn Beida Harriche | Commune | عين البيضاء حريش | 18,513 | 21,013 | → |
| Aïn Mellouk | Commune | عين ملوك | 12,716 | 14,200 | → |
| Aïn Tine | Commune | عين التين | 6,653 | 7,780 | → |
| Amira Arrès | Commune | عميرة أراس | 18,722 | 19,405 | → |
| Benyahia Abderrahmane | Commune | بن يحي .ع. رحمان | 10,222 | 10,052 | → |
| Bouhatem | Commune | بوحاتم | 19,193 | 20,277 | → |
| Chelghoum Laïd | Commune | شلغوم العيد | 66,384 | 82,560 | → |
| Chigara | Commune | الشيقارة | 13,609 | 14,661 | → |
| Derradji Bousselah | Commune | دراجى بوصلاح | 10,417 | 10,013 | → |
| Elayadi Barbes | Commune | العياضى برباس | 7,189 | 6,459 | → |
| El Mechira | Commune | المشيرة | 11,683 | 12,905 | → |
| Ferdjioua | Commune | فرجيوة | 40,441 | 50,167 | → |
| Grarem Gouga | Commune | قرام قوقة | 36,482 | 42,062 | → |
| Hamala | Commune | حمالة | 10,810 | 11,213 | → |
| Mila | Province Capital | ميلة | 59,959 | 69,052 | → |
| Minar Zarza | Commune | مينار زرزة | 20,620 | 22,535 | → |
| Oued Athmania | Commune | وادي العثمانية | 35,934 | 40,688 | → |
| Oued Endja | Commune | وادى عنجة | 16,802 | 19,739 | → |
| Oued Seguen | Commune | وادى سقن | 11,792 | 13,319 | → |
| Ouled Khalouf | Commune | أولاد خلوف | 11,058 | 11,396 | → |
| Rouached | Commune | رواشد | 25,399 | 27,086 | → |
| Sidi Khelifa | Commune | سيدي خليفة | 4,505 | 4,746 | → |
| Sidi Mérouane | Commune | سيدي مروان | 20,018 | 23,088 | → |
| Tadjenanet | Commune | تاجنانت | 43,151 | 53,536 | → |
| Tassadane Haddada | Commune | تسادان حدادة | 17,623 | 17,378 | → |
| Teleghma | Commune | ثلارغمة | 40,846 | 48,028 | → |
| Terrai Bainen | Commune | ترعى بينان | 20,685 | 23,299 | → |
| Tessala Lemtaï | Commune | تسالة لمطاي | 13,849 | 15,676 | → |
| Tiberguent | Commune | تيبرقنت | 8,286 | 9,282 | → |
| Yahia Beni Guecha | Commune | يحيى بنى قشة | 10,681 | 11,810 | → |
| Zeghaia | Commune | الزغاية | 15,751 | 17,638 | → |
| Algérie [Algeria] | Republic | الجزائر | 29,100,867 | 34,080,030 |
Source: Office National des Statistiques de l'Algérie (web).
Further information about the population structure:
| Gender (C 2008) | |
|---|---|
| Males | 386,591 |
| Females | 380,295 |
| Age Groups (C 2008) | |
|---|---|
| 0-14 years | 215,476 |
| 15-64 years | 511,810 |
| 65+ years | 39,354 |
| Age Distribution (C 2008) | |
|---|---|
| 0-9 years | 136,115 |
| 10-19 years | 171,839 |
| 20-29 years | 164,665 |
| 30-39 years | 104,044 |
| 40-49 years | 81,160 |
| 50-59 years | 52,907 |
| 60-69 years | 30,429 |
| 70-79 years | 18,746 |
| 80+ years | 6,735 |
| Clustering (C 2008) | |
|---|---|
| in main locality | 440,735 |
| in other settlements | 163,603 |
| scattered | 162,544 |