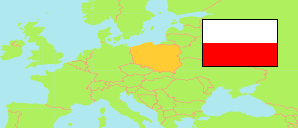
Warmińsko-Mazurskie
Woiwodschaft in Polen
Übersicht: Gliederung
Die Einwohnerentwicklung in Warmińsko-Mazurskie sowie verwandte Informationen und Dienste (Wikipedia, Google, Bilder).
| Name | Status | Einwohner Zensus 2002-05-20 | Einwohner Zensus 2011-03-31 | Einwohner Zensus 2021-03-31 | |
|---|---|---|---|---|---|
| Warmińsko-Mazurskie [Ermland-Masuren] | Woiwodschaft | 1.428.357 | 1.452.147 | 1.382.232 | |
| Powiat bartoszycki | Landkreis | 62.492 | 61.288 | 54.309 | → |
| Powiat braniewski | Landkreis | 44.569 | 43.544 | 38.548 | → |
| Powiat działdowski | Landkreis | 65.664 | 66.825 | 62.675 | → |
| Powiat Elbląg [Elbing] | Kreisfreie Stadt | 128.134 | 124.668 | 115.220 | → |
| Powiat elbląski | Landkreis | 56.361 | 58.326 | 55.296 | → |
| Powiat ełcki | Landkreis | 83.766 | 88.552 | 89.038 | → |
| Powiat giżycki | Landkreis | 56.974 | 57.789 | 54.798 | → |
| Powiat gołdapski | Landkreis | 27.106 | 27.565 | 25.534 | → |
| Powiat iławski | Landkreis | 89.196 | 92.915 | 90.918 | → |
| Powiat kętrzyński | Landkreis | 67.823 | 66.637 | 59.099 | → |
| Powiat lidzbarski | Landkreis | 43.546 | 43.182 | 39.238 | → |
| Powiat mrągowski | Landkreis | 50.373 | 51.429 | 48.714 | → |
| Powiat nidzicki | Landkreis | 34.066 | 34.364 | 31.107 | → |
| Powiat nowomiejski | Landkreis | 43.310 | 44.272 | 42.719 | → |
| Powiat olecki | Landkreis | 34.400 | 35.067 | 32.739 | → |
| Powiat Olsztyn [Allenstein] | Kreisfreie Stadt | 173.102 | 174.645 | 170.225 | → |
| Powiat olsztyński | Landkreis | 110.507 | 119.962 | 128.666 | → |
| Powiat ostródzki | Landkreis | 105.613 | 107.433 | 101.153 | → |
| Powiat piski | Landkreis | 57.766 | 58.504 | 53.348 | → |
| Powiat szczycieński | Landkreis | 69.621 | 71.365 | 67.452 | → |
| Powiat węgorzewski | Landkreis | 23.968 | 23.815 | 21.436 | → |
| Polska [Polen] | Republik | 38.230.080 | 38.511.824 | 38.036.118 |
Quelle: Główny Urząd Statystyczny, Warszawa.
Weitere Informationen zur Bevölkerungstruktur:
| Geschlecht (C 2021) | |
|---|---|
| männlich | 675.430 |
| weiblich | 706.802 |
| Altersgruppen (C 2021) | |
|---|---|
| 0-17 Jahre | 256.850 |
| 18-64 Jahre | 881.372 |
| ≥65 Jahre | 244.010 |
| Altersverteilung (C 2021) | |
|---|---|
| ≥90 Jahre | 8.877 |
| 80-89 Jahre | 44.864 |
| 70-79 Jahre | 98.842 |
| 60-69 Jahre | 194.403 |
| 50-59 Jahre | 174.239 |
| 40-49 Jahre | 207.901 |
| 30-39 Jahre | 215.517 |
| 20-29 Jahre | 153.432 |
| 10-19 Jahre | 146.822 |
| 0-9 Jahre | 137.335 |
| Urbanisierung (C 2021) | |
|---|---|
| ländlich | 563.198 |
| urban | 819.034 |
| Staatsangehörigkeit (C 2021) | |
|---|---|
| Polen | 1.380.509 |
| anderer Staat | 1.717 |
| Geburtsland (C 2021) | |
|---|---|
| Polen | 1.349.059 |
| anderer Staat | 31.931 |