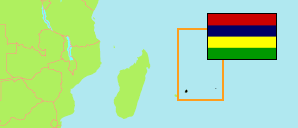
St. Aubin
Landgemeinde in Insel Mauritius
Übersicht: Einwohner
Die Einwohnerentwicklung in St. Aubin sowie verwandte Informationen und Dienste (Wikipedia, Google, Bilder).
| Name | Status | Einwohner Zensus 2000-07-02 | Einwohner Zensus 2011-07-03 | Einwohner Zensus 2022-07-03 | |
|---|---|---|---|---|---|
| St. Aubin | Landgemeinde | 1.569 | 1.346 | 1.318 | |
| Mauritius | Insel | 1.143.069 | 1.196.383 | 1.189.493 |
Quelle: Central Statistical Office of Mauritius.
Erläuterung: Flächenangaben wurden aus Geodaten abgeleitet.
Weitere Informationen zur Bevölkerungstruktur:
| Geschlecht (C 2022) | |
|---|---|
| männlich | 649 |
| weiblich | 669 |
| Altersgruppen (C 2022) | |
|---|---|
| 0-14 Jahre | 250 |
| 15-64 Jahre | 933 |
| ≥65 Jahre | 135 |
| Altersverteilung (C 2022) | |
|---|---|
| ≥70 Jahre | 78 |
| 60-69 Jahre | 131 |
| 50-59 Jahre | 175 |
| 40-49 Jahre | 186 |
| 30-39 Jahre | 192 |
| 20-29 Jahre | 213 |
| 10-19 Jahre | 175 |
| 0-9 Jahre | 168 |
| Urbanisierung (C 2022) | |
|---|---|
| ländlich | 1.318 |
| Umgangssprache (C 2022) | |
|---|---|
| Kreol | 1.270 |
| Französisch | 19 |
| Englisch | 3 |
| Bhojpuri | 22 |
| Hindi | 2 |
| andere Sprache | 2 |
| Religion (C 2022) | |
|---|---|
| Hindus | 450 |
| Muslime | 183 |
| Katholiken | 413 |
| Christen (andere) | 266 |
| andere/keine Religion | 6 |