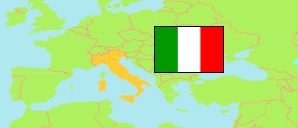
Lombardia
Region in Italien
Übersicht: Gliederung
Die Bevölkerungsentwicklung in Lombardia sowie verwandte Informationen und Dienste (Wikipedia, Google, Bilder).
| Name | Status | Einwohner Zensus 1981-10-25 | Einwohner Zensus 1991-10-20 | Einwohner Zensus 2001-10-21 | Einwohner Zensus 2011-10-09 | Einwohner Zensus 2021-12-31 | Einwohner Schätzung 2025-01-01 | |
|---|---|---|---|---|---|---|---|---|
| Lombardia [Lombardei] | Region | 8.891.652 | 8.856.074 | 9.032.554 | 9.704.151 | 9.943.004 | 10.035.481 | |
| Bergamo | Provinz | 875.624 | 911.392 | 974.873 | 1.088.284 | 1.102.997 | 1.115.037 | → |
| Brescia | Provinz | 1.017.093 | 1.044.544 | 1.108.776 | 1.238.044 | 1.253.157 | 1.266.138 | → |
| Como | Provinz | 511.425 | 522.147 | 537.500 | 586.735 | 594.941 | 598.333 | → |
| Cremona | Provinz | 332.236 | 327.970 | 335.939 | 357.623 | 351.654 | 353.995 | → |
| Lecco | Provinz | 285.047 | 294.248 | 309.708 | 334.303 | 332.457 | 333.804 | → |
| Lodi | Provinz | 179.102 | 184.025 | 197.672 | 223.755 | 227.327 | 230.447 | → |
| Mantova [Mantua] | Provinz | 377.158 | 369.630 | 377.790 | 408.336 | 404.476 | 407.312 | → |
| Milano [Mailand] | Metrolpolstadt | 3.139.490 | 3.009.338 | 2.940.579 | 3.038.420 | 3.214.630 | 3.247.623 | → |
| Monza e della Brianza | Provinz | 699.516 | 729.347 | 766.631 | 840.129 | 870.407 | 879.752 | → |
| Pavia | Provinz | 512.895 | 490.898 | 493.753 | 535.822 | 534.506 | 542.082 | → |
| Sondrio | Provinz | 174.009 | 175.496 | 176.856 | 180.814 | 178.784 | 179.051 | → |
| Varese | Provinz | 788.057 | 797.039 | 812.477 | 871.886 | 877.668 | 881.907 | → |
| Italia [Italien] | Republik | 56.556.911 | 56.778.031 | 56.995.744 | 59.433.744 | 59.030.133 | 58.934.177 |
Quelle: Istituto Nazionale di Statistica Italia.
Erläuterung: Die Angaben für 2025 sind vorläufig.
Weitere Informationen zur Bevölkerungstruktur:
| Geschlecht (E 2025) | |
|---|---|
| männlich | 4.946.391 |
| weiblich | 5.089.090 |
| Altersgruppen (E 2025) | |
|---|---|
| 0-17 Jahre | 1.528.355 |
| 18-64 Jahre | 6.113.059 |
| ≥65 Jahre | 2.394.067 |
| Altersverteilung (E 2025) | |
|---|---|
| ≥90 Jahre | 145.728 |
| 80-89 Jahre | 634.065 |
| 70-79 Jahre | 1.014.913 |
| 60-69 Jahre | 1.332.934 |
| 50-59 Jahre | 1.651.144 |
| 40-49 Jahre | 1.352.312 |
| 30-39 Jahre | 1.140.472 |
| 20-29 Jahre | 1.034.165 |
| 10-19 Jahre | 975.641 |
| 0-9 Jahre | 754.107 |
| Staatsangehörigkeit (E 2025) | |
|---|---|
| Italien | 8.805.119 |
| anderer Staat | 1.230.362 |