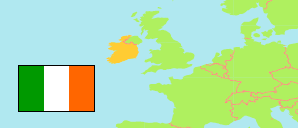
Kildare
Grafschaft in Irland
Übersicht: Einwohner
Die Bevölkerungsentwicklung von Kildare sowie verwandte Informationen und Dienste (Wikipedia, Google, Bilder).
| Name | Status | Einwohner Zensus 1981-04-05 | Einwohner Zensus 1986-04-13 | Einwohner Zensus 1991-04-21 | Einwohner Zensus 1996-04-28 | Einwohner Zensus 2002-04-28 | Einwohner Zensus 2006-04-23 | Einwohner Zensus 2011-04-10 | Einwohner Zensus 2016-04-24 | Einwohner Zensus 2022-04-03 | |
|---|---|---|---|---|---|---|---|---|---|---|---|
| Kildare | Grafschaft | 104.122 | 116.247 | 122.656 | 134.992 | 163.944 | 186.335 | 210.312 | 222.504 | 247.774 | |
| Ireland (Éire) [Irland] | Republik | 3.443.405 | 3.540.643 | 3.525.719 | 3.626.087 | 3.917.203 | 4.239.848 | 4.588.252 | 4.761.865 | 5.149.139 |
Quelle: Central Statistics Office, Ireland.
Weitere Informationen zur Bevölkerungstruktur:
| Geschlecht (C 2022) | |
|---|---|
| männlich | 123.264 |
| weiblich | 124.510 |
| Altersgruppen (C 2022) | |
|---|---|
| 0-17 Jahre | 64.261 |
| 18-64 Jahre | 153.793 |
| ≥65 Jahre | 29.720 |
| Altersverteilung (C 2022) | |
|---|---|
| ≥90 Jahre | 810 |
| 80-89 Jahre | 4.807 |
| 70-79 Jahre | 14.040 |
| 60-69 Jahre | 21.701 |
| 50-59 Jahre | 31.391 |
| 40-49 Jahre | 41.011 |
| 30-39 Jahre | 34.907 |
| 20-29 Jahre | 27.760 |
| 10-19 Jahre | 37.878 |
| 0-9 Jahre | 33.469 |
| Geburtsland (C 2022) | |
|---|---|
| Irland | 200.563 |
| anderer Staat | 47.211 |
| Religion (C 2022) | |
|---|---|
| katholisch | 173.014 |
| andere Religion | 24.624 |
| keine Religion | 38.087 |