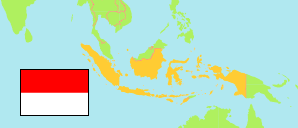
Indonesia: Papua Province
Contents: Regencies and Cities
The population of the regencies and cities of Papua Province according the census results.
| Name | Status | Population Census 2005-06-30 | Population Census 2010-05-01 | Population Census 2015-05-01 | Population Census 2020-09-15 | |
|---|---|---|---|---|---|---|
| Asmat | Regency | 61,642 | 76,577 | 88,373 | 110,105 | → |
| Biak Numfor | Regency | ... | 126,798 | 138,790 | 134,650 | → |
| Boven Digoel | Regency | ... | 55,784 | 62,862 | 64,285 | → |
| Deiyai | Regency | ... | 62,119 | 69,290 | 99,091 | → |
| Dogiyai | Regency | ... | 84,230 | 92,048 | 116,206 | → |
| Intan Jaya | Regency | ... | 40,490 | 45,846 | 135,043 | → |
| Jayapura (Nambluong) | Regency | 90,972 | 111,943 | 121,163 | 166,171 | → |
| Jayawijaya | Regency | ... | 196,085 | 206,133 | 269,553 | → |
| Keerom | Regency | 37,048 | 48,536 | 53,612 | 61,623 | → |
| Kepulauan Yapen [Yapen Islands] | Regency | ... | 82,951 | 91,240 | 112,676 | → |
| Kota Jayapura | City | 197,396 | 256,705 | 282,766 | 398,478 | → |
| Lanny Jaya | Regency | ... | 148,522 | 172,438 | 196,399 | → |
| Mamberamo Raya | Regency | ... | 18,365 | 21,301 | 36,483 | → |
| Mamberamo Tengah [Central Mamberamo] | Regency | ... | 39,537 | 46,198 | 50,685 | → |
| Mappi | Regency | 65,219 | 81,658 | 91,657 | 108,295 | → |
| Merauke | Regency | 154,310 | 195,716 | 216,271 | 230,932 | → |
| Mimika | Regency | ... | 182,001 | 201,300 | 311,969 | → |
| Nabire | Regency | ... | 129,893 | 139,921 | 169,136 | → |
| Nduga | Regency | ... | 79,053 | 93,862 | 106,533 | → |
| Paniai | Regency | ... | 153,432 | 164,008 | 220,410 | → |
| Pegunungan Bintang [Bintang Mountains] | Regency | ... | 65,434 | 71,608 | 77,872 | → |
| Puncak | Regency | ... | 93,218 | 103,342 | 114,741 | → |
| Puncak Jaya | Regency | ... | 101,148 | 114,978 | 224,527 | → |
| Sarmi | Regency | ... | 32,971 | 36,714 | 41,515 | → |
| Supiori | Regency | ... | 15,874 | 18,222 | 22,547 | → |
| Tolikara | Regency | ... | 114,427 | 130,862 | 236,986 | → |
| Waropen | Regency | ... | 24,639 | 28,444 | 33,943 | → |
| Yahukimo | Regency | 134,702 | 164,512 | 181,139 | 350,880 | → |
| Yalimo | Regency | ... | 50,763 | 58,700 | 101,973 | → |
| Papua (Irian Jaya) | Province | 1,875,388 | 2,833,381 | 3,143,088 | 4,303,707 |
Source: Badan Pusat Statistik, Republik Indonesia (web).
Explanation: 2005 and 2015 figures are result of an intermediate census.
Further information about the population structure:
| Gender (C 2020) | |
|---|---|
| Males | 2,294,813 |
| Females | 2,008,894 |
| Age Groups (C 2020) | |
|---|---|
| 0-14 years | 1,158,039 |
| 15-59 years | 3,000,987 |
| 65+ years | 144,681 |
| Age Distribution (C 2020) | |
|---|---|
| 90+ years | 531 |
| 80-89 years | 11,420 |
| 70-79 years | 62,394 |
| 60-69 years | 181,465 |
| 50-59 years | 383,142 |
| 40-49 years | 598,297 |
| 30-39 years | 758,132 |
| 20-29 years | 805,879 |
| 10-19 years | 679,709 |
| 0-9 years | 822,738 |