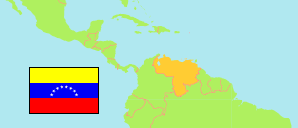
Anzoátegui
State in Venezuela
Contents: Subdivision
The population development in Anzoátegui as well as related information and services (Wikipedia, Google, images).
| Name | Status | Population Estimate 2001-06-30 | Population Estimate 2011-06-30 | Population Projection 2019-06-30 | |
|---|---|---|---|---|---|
| Anzoátegui | State | 1,325,801 | 1,563,334 | 1,753,856 | |
| Anaco | Municipality | 112,413 | 132,507 | 148,480 | → |
| Aragua | Municipality | 23,494 | 29,478 | 34,721 | → |
| Diego Bautista Urbaneja | Municipality | 32,200 | 40,069 | 46,887 | → |
| Fernando de Peñalver | Municipality | 30,209 | 37,546 | 43,893 | → |
| Francisco del Carmen Carvajal | Municipality | 12,757 | 14,714 | 16,206 | → |
| Francisco de Miranda | Municipality | 39,419 | 43,743 | 46,709 | → |
| Guanta | Municipality | 26,285 | 32,534 | 37,907 | → |
| Independencia | Municipality | 26,067 | 32,576 | 38,249 | → |
| José Gregorio Monagas | Municipality | 15,837 | 18,013 | 19,618 | → |
| Juan Antonio Sotillo | Municipality | 207,797 | 257,926 | 300,908 | → |
| Juan Manuel Cajigal | Municipality | 11,211 | 13,766 | 15,937 | → |
| Libertad | Municipality | 14,381 | 16,379 | 17,858 | → |
| Manuel Ezequiel Bruzual | Municipality | 28,769 | 33,085 | 36,352 | → |
| Pedro María Freites | Municipality | 72,382 | 80,128 | 85,394 | → |
| Píritu | Municipality | 21,337 | 25,419 | 28,725 | → |
| San José de Guanipa | Municipality | 71,586 | 78,280 | 82,608 | → |
| San Juan de Capistrano | Municipality | 7,751 | 9,378 | 10,732 | → |
| Santa Ana | Municipality | 8,045 | 9,825 | 11,325 | → |
| Simón Bolívar | Municipality | 387,817 | 451,042 | 499,976 | → |
| Simón Rodríguez | Municipality | 167,996 | 196,897 | 219,622 | → |
| Sir Arthur Mc Gregor | Municipality | 8,048 | 10,029 | 11,749 | → |
| Venezuela | Republic | 24,802,885 | 28,944,070 | 32,219,521 |
Source: Instituto Nacional de Estadística, Venezuela (web).
Explanation: The population projection does not consider emigration caused by the current economical and political situation in Venezuela.
Further information about the population structure:
| Gender (C 2011) | |
|---|---|
| Males | 738,352 |
| Females | 731,395 |
| Age Groups (C 2011) | |
|---|---|
| 0-14 years | 409,173 |
| 15-64 years | 985,473 |
| 65+ years | 75,101 |
| Age Distribution (C 2011) | |
|---|---|
| 0-9 years | 268,958 |
| 10-19 years | 281,502 |
| 20-29 years | 268,671 |
| 30-39 years | 235,002 |
| 40-49 years | 174,513 |
| 50-59 years | 123,975 |
| 60-69 years | 69,380 |
| 70-79 years | 32,590 |
| 80+ years | 15,156 |
| Urbanization (C 2011) | |
|---|---|
| Rural | 123,916 |
| Urban | 1,345,831 |
| Ethnic Group (C 2011) | |
|---|---|
| Indigenous | 33,848 |
| Afro-Venezuelan | 55,542 |
| Mestizos | 783,448 |
| White | 570,794 |
| Other Ethnic Group | 17,175 |
| Literacy (A10+) (C 2011) | |
|---|---|
| yes | 1,154,219 |
| no | 46,570 |