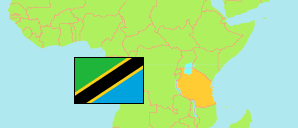
Mbogwe
District in Tanzania
Contents: Population
The population development of Mbogwe as well as related information and services (Wikipedia, Google, images).
| Name | Status | Population Census 1988-08-27 | Population Census 2002-08-01 | Population Census 2012-08-26 | Population Census 2022-08-23 | |
|---|---|---|---|---|---|---|
| Mbogwe | District | ... | ... | 193,922 | 362,855 | |
| Tanzania | United Republic | 23,174,336 | 34,443,603 | 44,928,923 | 61,741,120 |
Source: National Bureau of Statistics Tanzania.
Explanation: Area figures of districts are calculated from geospatial data.
Further information about the population structure:
| Gender (C 2022) | |
|---|---|
| Males | 179,157 |
| Females | 183,698 |
| Urbanization (C 2022) | |
|---|---|
| Rural | 253,014 |
| Urban | 109,841 |
| Age Groups (C 2022) | |
|---|---|
| 0-14 years | 179,957 |
| 15-64 years | 174,795 |
| 65+ years | 8,103 |
| Age Distribution (C 2022) | |
|---|---|
| 80+ years | 2,186 |
| 70-79 years | 3,532 |
| 60-69 years | 7,311 |
| 50-59 years | 13,007 |
| 40-49 years | 21,712 |
| 30-39 years | 36,357 |
| 20-29 years | 60,267 |
| 10-19 years | 90,877 |
| 0-9 years | 127,606 |