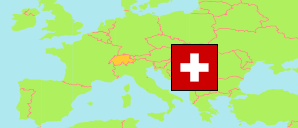
Bezirk Hinwil
District in Zürich (Switzerland)
Contents: Population
The population development of Bezirk Hinwil as well as related information and services (Wikipedia, Google, images).
| Name | Status | Population Census 1980-12-02 | Population Census 1990-12-04 | Population Census 2000-12-05 | Population Estimate 2010-12-31 | Population Estimate 2020-12-31 | Population Estimate 2023-12-31 | |
|---|---|---|---|---|---|---|---|---|
| Bezirk Hinwil | District | 62,980 | 70,609 | 77,206 | 87,822 | 97,098 | 100,837 | |
| Schweiz (Suisse, Svizzera, Svizra, Helvetia) [Switzerland] | Confederation | 6,365,960 | 6,873,687 | 7,288,010 | 7,870,134 | 8,670,300 | 8,960,817 |
Source: Swiss Federal Statistical Office.
Explanation: The population figures for 2023 are preliminary.
Further information about the population structure:
| Gender (E 2022) | |
|---|---|
| Males | 49,532 |
| Females | 49,688 |
| Age Groups (E 2022) | |
|---|---|
| 0-17 years | 18,306 |
| 18-64 years | 61,767 |
| 65+ years | 19,147 |
| Age Distribution (E 2022) | |
|---|---|
| 90+ years | 813 |
| 80-89 years | 4,342 |
| 70-79 years | 8,735 |
| 60-69 years | 11,929 |
| 50-59 years | 14,932 |
| 40-49 years | 13,450 |
| 30-39 years | 13,591 |
| 20-29 years | 11,114 |
| 10-19 years | 10,030 |
| 0-9 years | 10,284 |
| Citizenship (E 2022) | |
|---|---|
| Switzerland | 78,368 |
| Germany | 3,552 |
| France | 171 |
| Italy | 3,532 |
| Portugal | 2,212 |
| EU (others) | 3,946 |
| Europe (non-EU countries) | 4,497 |
| Africa | 782 |
| Asia | 1,628 |
| Other country | 519 |
| Country of Birth (E 2022) | |
|---|---|
| Switzerland | 73,374 |
| Other country | 25,846 |