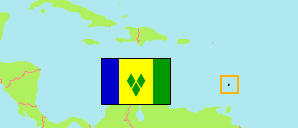
Islands & Census Districts
The population of the islands and census districts of Saint Vincent and the Grenadines according to census results.
| Name | Abbr. | Status | Area A (hect) | Population Census (C) 1980-05-12 | Population Census (C) 1991-05-12 | Population Census (C) 2001-06-12 | Population Census (C) 2012-06-12 | |||
|---|---|---|---|---|---|---|---|---|---|---|
| St. Vincent and the Grenadines | VCT | 38,930 | 97,845 | 107,598 | 109,022 | 109,991 | ||||
| Barrouallie (St. Patrick) | Dist | 3,680 | 4,667 | 5,222 | 5,463 | 5,884 | 3680 | |||
| Bridgetown | Dist | 1,860 | 6,762 | 7,528 | 6,779 | 6,568 | 1860 | |||
| Calliaqua | Dist | 3,060 | 17,440 | 20,689 | 22,706 | 24,205 | 3060 | |||
| Chateaubelair (St. David) | Dist | 8,000 | 6,101 | 6,056 | 6,081 | 5,756 | 8000 | |||
| Colonarie | Dist | 3,470 | 7,210 | 7,864 | 7,491 | 6,849 | 3470 | |||
| Georgetown | Dist | 5,750 | 6,494 | 7,347 | 6,985 | 7,061 | 5750 | |||
| Kingstown | Dist | 490 | 16,532 | 15,670 | 13,857 | 12,909 | 490 | |||
| Layou (St. Andrew) | Dist | 2,870 | 5,510 | 5,949 | 6,338 | 6,339 | 2870 | |||
| Marriaqua | Dist | 2,430 | 8,408 | 8,843 | 8,254 | 7,798 | 2430 | |||
| Sandy Bay | Dist | 1,370 | 2,867 | 2,802 | 2,805 | 2,576 | 1370 | |||
| Suburbs of Kingstown | Dist | 1,660 | 8,609 | 10,872 | 13,027 | 13,812 | 1660 | |||
| St. Vincent | VIN | Isl | 34,660 | 90,600 | 98,842 | 99,786 | 99,757 | 34660 | ||
| Northern Grenadines | Dist | 2,330 | 4,740 | 5,830 | 5,647 | 6,184 | 2330 | |||
| Southern Grenadines | Dist | 1,940 | 2,505 | 2,926 | 3,589 | 4,050 | 1940 | |||
| Grenadines | GRE | Isl | 4,270 | 7,245 | 8,756 | 9,236 | 10,234 | 4270 |
- The total mid-2022 population is estimated to be 110,872 .
- Government of St. Vincent & the Grenadines - Statistical Office (web).
Major Agglomeration
| Name | Adm. | Population Census (C) 2012-06-12 | |
|---|---|---|---|
| 1 | Kingstown | VIN | 26,721 |
Contents: Capital
The population development of the capital Kingstown according to census results.
| Name | Adm. | Population Census (C) 1980-05-12 | Population Census (C) 1991-05-12 | Population Census (C) 2001-06-12 | Population Census (C) 2012-06-12 | Area | |
|---|---|---|---|---|---|---|---|
| Kingstown | VIN | 16,532 | 15,670 | 13,857 | 12,909 | 0 |
- Government of St. Vincent & the Grenadines - Statistical Office (web).
Population Structure
Further information about the population structure.
| Gender (C 2012) | |
|---|---|
| Males | 55,551 |
| Females | 53,637 |
| Age Groups (C 2012) | |
|---|---|
| 0-14 years | 26,925 |
| 15-64 years | 72,273 |
| 65+ years | 9,990 |
| Age Distribution (C 2012) | |
|---|---|
| 0-9 years | 17,165 |
| 10-19 years | 19,672 |
| 20-29 years | 16,924 |
| 30-39 years | 15,416 |
| 40-49 years | 14,621 |
| 50-59 years | 11,579 |
| 60-69 years | 6,662 |
| 70-79 years | 4,514 |
| 80+ years | 2,635 |
| Country of Birth (C 2012) | |
|---|---|
| St. Vincent | 101,515 |
| Other country | 4,898 |
