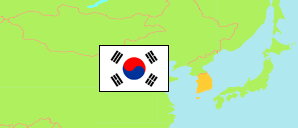
Gyeongju (South Korea)
Contents: Urban Area
The population development of Gyeongju as well as related information and services (weather, Wikipedia, Google, images).
| Name | Native | Province | Population Census 2005-11-01 | Population Census 2010-11-01 | Population Census 2015-11-01 | Population Census 2020-11-01 | |
|---|---|---|---|---|---|---|---|
| Gyeongju | 경주 | Gyeongsangbuk-do | 143,512 | 145,594 | 149,293 | 144,472 | → |
Source: National Statistical Office of the Republic of Korea (web).
Explanation: Since 2015, a register-based census is performed. Nevertheless, the results are not consistent with the population figures from the resident registration that are higher by about 3.5% on average. Area figures are derived from geospatial data.
Further information about the population structure:
| Gender (C 2020) | |
|---|---|
| Males | 71,874 |
| Females | 72,598 |
| Age Groups (C 2020) | |
|---|---|
| 0-14 years | 16,214 |
| 15-64 years | 102,779 |
| 65+ years | 25,479 |
| Age Distribution (C 2020) | |
|---|---|
| 90+ years | 792 |
| 80-89 years | 5,410 |
| 70-79 years | 10,890 |
| 60-69 years | 19,633 |
| 50-59 years | 25,122 |
| 40-49 years | 22,368 |
| 30-39 years | 16,694 |
| 20-29 years | 20,016 |
| 10-19 years | 13,496 |
| 0-9 years | 10,031 |
| Citizenship (C 2020) | |
|---|---|
| Korea | 135,509 |
| Foreign Citizenship | 8,963 |