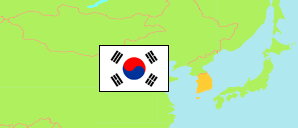
Sangju-si
City in North Gyeongsang Province
Contents: Subdivision
The population development in Sangju-si as well as related information and services (Wikipedia, Google, images).
| Name | Status | Native | Population Census 2005-11-01 | Population Census 2010-11-01 | Population Census 2015-11-01 | Population Census 2020-11-01 | |
|---|---|---|---|---|---|---|---|
| Sangju-si | City | 상주시 | 105,937 | 98,103 | 98,760 | 95,473 | |
| Bungmun-dong | Quarter | 북문동 | 6,262 | 6,540 | 8,788 | 9,330 | → |
| Cheongni-myeon | Rural Township | 청리면 | 3,307 | 2,772 | 2,745 | 2,643 | → |
| Dongmun-dong | Quarter | 동문동 | 10,790 | 9,819 | 8,992 | 8,504 | → |
| Dongseong-dong | Quarter | 동성동 | 4,767 | 3,953 | 3,898 | 3,484 | → |
| Euncheok-myeon | Rural Township | 은척면 | 1,760 | 1,638 | 1,508 | 1,494 | → |
| Gonggeom-myeon | Rural Township | 공검면 | 2,816 | 2,275 | 2,207 | 2,049 | → |
| Gongseong-myeon | Rural Township | 공성면 | 5,144 | 4,224 | 4,122 | 3,764 | → |
| Gyerim-dong | Quarter | 계림동 | 8,451 | 8,059 | 7,877 | 7,753 | → |
| Hamchang-eup | Town | 함창읍 | 7,721 | 6,524 | 6,452 | 6,429 | → |
| Hwabuk-myeon | Rural Township | 화북면 | 1,473 | 1,508 | 1,519 | 1,462 | → |
| Hwadong-myeon | Rural Township | 화동면 | 2,103 | 1,965 | 1,991 | 1,869 | → |
| Hwanam-myeon | Rural Township | 화남면 | 846 | 863 | 838 | 776 | → |
| Hwaseo-myeon | Rural Township | 화서면 | 2,972 | 2,727 | 2,730 | 2,649 | → |
| Ian-myeon | Rural Township | 이안면 | 2,499 | 2,039 | 2,024 | 1,918 | → |
| Jungdong-myeon | Rural Township | 중동면 | 1,553 | 1,600 | 1,359 | 1,269 | → |
| Modong-myeon | Rural Township | 모동면 | 2,636 | 2,470 | 2,581 | 2,441 | → |
| Moseo-myeon | Rural Township | 모서면 | 2,612 | 2,391 | 2,531 | 2,373 | → |
| Naeseo-myeon | Rural Township | 내서면 | 2,182 | 1,885 | 1,891 | 1,838 | → |
| Nakdong-myeon | Rural Township | 낙동면 | 4,303 | 4,074 | 4,138 | 3,952 | → |
| Namwon-dong | Quarter | 남원동 | 12,342 | 12,222 | 11,845 | 12,180 | → |
| Oenam-myeon | Rural Township | 외남면 | 1,750 | 1,615 | 1,621 | 1,553 | → |
| Oeseo-myeon | Rural Township | 외서면 | 2,844 | 2,504 | 2,557 | 2,404 | → |
| Sabeolguk-myeon [Sabeol-myeon] | Rural Township | 사벌국면 | 4,115 | 3,543 | 3,736 | 3,636 | → |
| Sinheung-dong | Quarter | 신흥동 | 10,689 | 10,893 | 10,810 | 9,703 | → |
| Gyeongsangbuk-do [North Gyeongsang] | Province | 경상북도 | 2,607,641 | 2,600,032 | 2,680,294 | 2,644,757 |
Source: National Statistical Office of the Republic of Korea (web).
Explanation: Since 2015, a register-based census is performed. Nevertheless, the results are not consistent with the population figures from the resident registration that are higher by about 3.5% on average. Area figures are derived from geospatial data.
Further information about the population structure:
| Gender (C 2020) | |
|---|---|
| Males | 47,016 |
| Females | 48,457 |
| Age Groups (C 2020) | |
|---|---|
| 0-14 years | 8,561 |
| 15-64 years | 57,541 |
| 65+ years | 29,371 |
| Age Distribution (C 2020) | |
|---|---|
| 90+ years | 1,160 |
| 80-89 years | 8,031 |
| 70-79 years | 12,338 |
| 60-69 years | 17,692 |
| 50-59 years | 16,170 |
| 40-49 years | 11,131 |
| 30-39 years | 7,564 |
| 20-29 years | 8,744 |
| 10-19 years | 7,469 |
| 0-9 years | 5,174 |
| Citizenship (C 2020) | |
|---|---|
| Korea | 94,167 |
| Foreign Citizenship | 1,306 |