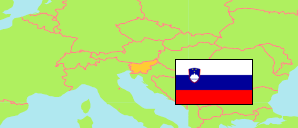
Gorje
Municipality in Slovenia
Contents: Population
The population development of Gorje as well as related information and services (Wikipedia, Google, images).
| Name | Status | Population Census 2002-03-31 | Population Census 2011-01-01 | Population Census 2021-01-01 | Population Estimate 2022-01-01 | |
|---|---|---|---|---|---|---|
| Gorje | Municipality | 2,856 | 2,935 | 2,769 | 2,779 | |
| Slovenija [Slovenia] | Republic | 1,964,036 | 2,050,189 | 2,108,977 | 2,107,180 |
Source: Statistical Office of the Republic of Slovenia (web).
Explanation: The 2011 and 2021 population figures are result of a register-based census.
Further information about the population structure:
| Gender (E 2022) | |
|---|---|
| Males | 1,377 |
| Females | 1,402 |
| Age Groups (E 2022) | |
|---|---|
| 0-17 years | 493 |
| 18-64 years | 1,660 |
| 65+ years | 626 |
| Age Distribution (E 2022) | |
|---|---|
| 90+ years | 23 |
| 80-89 years | 132 |
| 70-79 years | 285 |
| 60-69 years | 367 |
| 50-59 years | 398 |
| 40-49 years | 417 |
| 30-39 years | 341 |
| 20-29 years | 262 |
| 10-19 years | 288 |
| 0-9 years | 266 |
| Citizenship (E 2022) | |
|---|---|
| Slovenia | 2,685 |
| Foreign Citizenship | 94 |
| Country of Birth (E 2018) | |
|---|---|
| Slovenia | 2,650 |
| Former Yugoslavia (w/o Croatia) | 70 |
| EU-28 | 47 |
| Europe (Rest) | 9 |
| Other country | 16 |