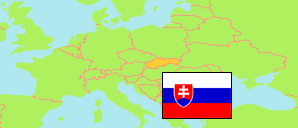
Krivá
in Dolný Kubín (Žilinský kraj)
Contents: Municipality
The population development of Krivá as well as related information and services (weather, Wikipedia, Google, images).
| Name | District | Population Census 1991-03-03 | Population Census 2001-05-26 | Population Census 2011-05-21 | Population Census 2021-01-01 | Population Estimate 2023-12-31 | |
|---|---|---|---|---|---|---|---|
| Krivá | Dolný Kubín | 746 | 775 | 801 | 808 | 816 | → |
Source: Statistical Office of the Slovak Republic.
Further information about the population structure:
| Gender (E 2023) | |
|---|---|
| Males | 422 |
| Females | 394 |
| Age Groups (E 2023) | |
|---|---|
| 0-17 years | 169 |
| 18-64 years | 507 |
| 65+ years | 140 |
| Age Distribution (E 2023) | |
|---|---|
| 90+ years | 4 |
| 80-89 years | 21 |
| 70-79 years | 67 |
| 60-69 years | 108 |
| 50-59 years | 86 |
| 40-49 years | 123 |
| 30-39 years | 111 |
| 20-29 years | 115 |
| 10-19 years | 79 |
| 0-9 years | 102 |
| Urbanization (C 2021) | |
|---|---|
| Rural | 808 |
| Citizenship (C 2021) | |
|---|---|
| Slovakia | 807 |
| Foreign Citizenship | 1 |
| Country of Birth (C 2021) | |
|---|---|
| Slovakia | 794 |
| Other country | 13 |
| Ethnic Group (C 2021) | |
|---|---|
| Slovak | 800 |
| Other ethnic groups | 2 |
| Mother Tongue (C 2021) | |
|---|---|
| Slovak | 796 |
| Czech | 2 |
| Other language | 5 |
| Religion (C 2021) | |
|---|---|
| Roman Catholic | 749 |
| Evangelical Church | 3 |
| Greek Catholic | 3 |
| Other christian church | 3 |
| Other religion | 5 |
| No religion | 38 |