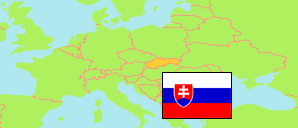
Sabinov
District in Slovakia
Contents: Population
The population development of Sabinov as well as related information and services (Wikipedia, Google, images).
| Name | Status | Population Census 1991-03-03 | Population Census 2001-05-26 | Population Census 2011-05-21 | Population Census 2021-01-01 | Population Estimate 2023-12-31 | |
|---|---|---|---|---|---|---|---|
| Sabinov | District | 49,200 | 54,067 | 57,820 | 60,389 | 61,542 | |
| Slovensko [Slovakia] | Republic | 5,274,335 | 5,379,455 | 5,397,036 | 5,449,270 | 5,424,687 |
Source: Statistical Office of the Slovak Republic.
Further information about the population structure:
| Gender (E 2023) | |
|---|---|
| Males | 30,899 |
| Females | 30,643 |
| Age Groups (E 2023) | |
|---|---|
| 0-17 years | 16,786 |
| 18-64 years | 36,800 |
| 65+ years | 7,956 |
| Age Distribution (E 2023) | |
|---|---|
| 90+ years | 218 |
| 80-89 years | 1,416 |
| 70-79 years | 3,601 |
| 60-69 years | 5,653 |
| 50-59 years | 6,897 |
| 40-49 years | 8,027 |
| 30-39 years | 8,634 |
| 20-29 years | 8,685 |
| 10-19 years | 8,550 |
| 0-9 years | 9,861 |
| Urbanization (C 2021) | |
|---|---|
| Rural | 41,560 |
| Urban | 18,829 |
| Citizenship (C 2021) | |
|---|---|
| Slovakia | 60,213 |
| Foreign Citizenship | 160 |
| Country of Birth (C 2021) | |
|---|---|
| Slovakia | 59,011 |
| Other country | 1,338 |
| Ethnic Group (C 2021) | |
|---|---|
| Slovak | 52,272 |
| Hungarian | 30 |
| Romani | 5,449 |
| Ruthenian | 332 |
| Czech | 94 |
| Other ethnic groups | 171 |
| Mother Tongue (C 2021) | |
|---|---|
| Slovak | 48,583 |
| Hungarian | 45 |
| Romani | 8,919 |
| Ruthenian | 464 |
| Czech | 115 |
| Other language | 183 |
| Religion (C 2021) | |
|---|---|
| Roman Catholic | 45,432 |
| Evangelical Church | 827 |
| Greek Catholic | 5,698 |
| Reformed (Calvinists) | 23 |
| Orthodox | 718 |
| Other christian church | 1,609 |
| Other religion | 188 |
| No religion | 3,543 |