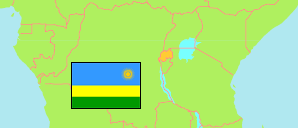
Rwamagana
District in Rwanda
Contents: Subdivision
The population development in Rwamagana as well as related information and services (Wikipedia, Google, images).
| Name | Status | Population Census 2012-08-15 | Population Census 2022-08-15 | |
|---|---|---|---|---|
| Rwamagana | District | 313,461 | 484,953 | |
| Fumbwe | Sector | 21,682 | 33,074 | → |
| Gahengeri | Sector | 23,517 | 35,732 | → |
| Gishali | Sector | 23,033 | 36,692 | → |
| Karenge | Sector | 22,755 | 28,525 | → |
| Kigabiro | Sector | 32,730 | 47,358 | → |
| Muhazi | Sector | 29,505 | 53,482 | → |
| Munyaga | Sector | 16,207 | 20,812 | → |
| Munyiginya | Sector | 16,980 | 24,197 | → |
| Musha | Sector | 21,145 | 27,525 | → |
| Muyumbu | Sector | 24,242 | 56,881 | → |
| Mwulire | Sector | 21,829 | 33,936 | → |
| Nyakaliro | Sector | 20,196 | 37,538 | → |
| Nzige | Sector | 15,504 | 19,285 | → |
| Rubona | Sector | 24,136 | 29,916 | → |
| Rwanda | Republic | 10,515,973 | 13,246,394 |
Source: National Institute of Statistics Rwanda.
Further information about the population structure:
| Gender (C 2022) | |
|---|---|
| Males | 243,794 |
| Females | 241,159 |
| Age Groups (C 2022) | |
|---|---|
| 0-14 years | 178,432 |
| 15-64 years | 288,210 |
| 65+ years | 18,311 |
| Age Distribution (C 2022) | |
|---|---|
| 80+ years | 3,889 |
| 70-79 years | 7,647 |
| 60-69 years | 16,781 |
| 50-59 years | 26,250 |
| 40-49 years | 46,710 |
| 30-39 years | 72,442 |
| 20-29 years | 80,796 |
| 10-19 years | 107,745 |
| 0-9 years | 122,693 |
| Urbanization (C 2022) | |
|---|---|
| Rural | 304,897 |
| Urban | 180,056 |