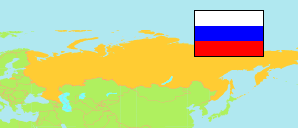
Chabarovsk Kraj
Territory in Russia
Contents: Population
The population development of Chabarovsk Kraj as well as related information and services (Wikipedia, Google, images).
| Name | Status | Native | Population Census 1979-01-17 | Population Census 1989-01-12 | Population Census 2002-10-09 | Population Census 2010-10-14 | Population Census 2021-10-01 | |
|---|---|---|---|---|---|---|---|---|
| Chabarovsk Kraj [Khabarovsk Krai] | Territory | Хабаровский край | 1,375,752 | 1,608,569 | 1,436,570 | 1,343,869 | 1,292,944 | |
| Russija [Russia] | Federation | Россия | 137,550,949 | 147,400,537 | 145,166,731 | 142,856,536 | 144,699,673 |
Source: Federal State Statistics Service Russia (web).
Further information about the population structure:
| Gender (C 2021) | |
|---|---|
| Males | 609,253 |
| Females | 683,691 |
| Age Groups (C 2021) | |
|---|---|
| 0-14 years | 210,310 |
| 15-64 years | 881,474 |
| 65+ years | 201,160 |
| Age Distribution (C 2021) | |
|---|---|
| 80+ years | 38,973 |
| 70-79 years | 86,837 |
| 60-69 years | 154,125 |
| 50-59 years | 156,288 |
| 40-49 years | 200,178 |
| 30-39 years | 229,959 |
| 20-29 years | 144,957 |
| 10-19 years | 140,465 |
| 0-9 years | 141,162 |
| Urbanization (C 2021) | |
|---|---|
| Rural | 214,604 |
| Urban | 1,078,340 |