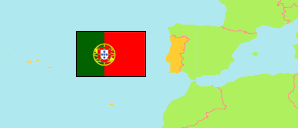
Guarda (Portugal)
District
The population development of Guarda.
| Name | Status | Population Census 2001-03-12 | Population Census 2011-03-21 | Population Census 2021-03-22 | |
|---|---|---|---|---|---|
| Guarda | District | 179,961 | 160,939 | 142,974 | → |
| Portugal | Republic | 10,356,117 | 10,562,178 | 10,343,066 |
Contents: Urban Areas
The population development of the urban areas in Guarda.
| Name | Status | District / Region | Population Census 2001-03-12 | Population Census 2011-03-21 | Population Census 2021-03-22 | |
|---|---|---|---|---|---|---|
| Guarda | Urban Area | Guarda | 25,807 | 26,565 | 26,441 | → |
| Santa Marinha e São Martinho | Urban Area | Guarda | 1,991 | 1,629 | 1,365 | → |
| Seia | Urban Area | Guarda | 10,422 | 9,379 | 8,705 | → |
| Vilar Formoso | Urban Area | Guarda | 2,481 | 2,219 | 1,791 | → |
Source: Instituto Nacional de Estatística Portugal (web).
Explanation: The territorial units consist of predominant urban parishes (freguesias) as defined by TIPAU 2014 (Tipologia de Áreas Urbanas). The tabulated population figures are computed by »City Population«.