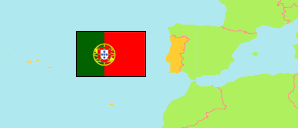
Gouveia
Municipality in Guarda District
Contents: Subdivision
The population development in Gouveia as well as related information and services (Wikipedia, Google, images).
| Name | Status | Population Census 2001-03-12 | Population Census 2011-03-21 | Population Census 2021-03-22 | |
|---|---|---|---|---|---|
| Gouveia | Municipality | 16,122 | 14,046 | 12,222 | |
| Aldeias e Mangualde da Serra | Parish | 536 | 492 | 424 | → |
| Arcozelo | Parish | 858 | 717 | 570 | → |
| Cativelos | Parish | 873 | 724 | 610 | → |
| Figueiró da Serra e Freixo da Serra | Parish | 441 | 362 | 377 | → |
| Folgosinho | Parish | 580 | 499 | 442 | → |
| Gouveia | Parish | 3,875 | 3,472 | 3,150 | → |
| Melo e Nabais | Parish | 1,102 | 903 | 800 | → |
| Moimenta da Serra e Vinhó | Parish | 1,331 | 1,230 | 1,071 | → |
| Nespereira | Parish | 861 | 758 | 661 | → |
| Paços da Serra | Parish | 726 | 601 | 502 | → |
| Ribamondego | Parish | 338 | 317 | 262 | → |
| Rio Torto e Lagarinhos | Parish | 1,030 | 906 | 745 | → |
| São Paio | Parish | 945 | 828 | 699 | → |
| Vila Cortês da Serra | Parish | 312 | 267 | 202 | → |
| Vila Franca da Serra | Parish | 303 | 262 | 238 | → |
| Vila Nova de Tazem | Parish | 2,011 | 1,708 | 1,469 | → |
| Guarda | District | 179,961 | 160,939 | 142,974 |
Source: Instituto Nacional de Estatística Portugal (web).
Further information about the population structure:
| Gender (C 2021) | |
|---|---|
| Males | 5,705 |
| Females | 6,517 |
| Age Groups (C 2021) | |
|---|---|
| 0-14 years | 1,118 |
| 15-64 years | 6,435 |
| 65+ years | 4,669 |
| Age Distribution (C 2021) | |
|---|---|
| 80+ years | 1,657 |
| 70-79 years | 1,939 |
| 60-69 years | 2,099 |
| 50-59 years | 1,704 |
| 40-49 years | 1,400 |
| 30-39 years | 914 |
| 20-29 years | 936 |
| 10-19 years | 911 |
| 0-9 years | 662 |
| Citizenship (C 2021) | |
|---|---|
| Portugal | 12,018 |
| EU | 76 |
| Europe (other) | 35 |
| Africa | 31 |
| America | 50 |
| Asia & Oceania | 12 |
| Country of Birth (C 2021) | |
|---|---|
| Portugal | 11,438 |
| EU | 241 |
| Europe (other) | 116 |
| Africa | 330 |
| America | 84 |
| Asia & Oceania | 13 |