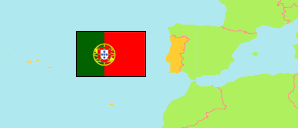
Porto
District in Portugal
Contents: Subdivision
The population development in Porto as well as related information and services (Wikipedia, Google, images).
| Name | Status | Population Census 2001-03-12 | Population Census 2011-03-21 | Population Census 2021-03-22 | |
|---|---|---|---|---|---|
| Porto | District | 1,781,836 | 1,817,175 | 1,785,405 | |
| Amarante | Municipality | 59,638 | 56,264 | 52,116 | → |
| Baião | Municipality | 22,355 | 20,522 | 17,534 | → |
| Felgueiras | Municipality | 57,595 | 58,065 | 55,848 | → |
| Gondomar | Municipality | 164,096 | 168,027 | 164,257 | → |
| Lousada | Municipality | 44,712 | 47,387 | 47,364 | → |
| Maia | Municipality | 120,111 | 135,306 | 134,977 | → |
| Marco de Canaveses | Municipality | 52,419 | 53,450 | 49,541 | → |
| Matosinhos | Municipality | 167,026 | 175,478 | 172,557 | → |
| Paços de Ferreira | Municipality | 52,985 | 56,340 | 55,595 | → |
| Paredes | Municipality | 83,376 | 86,854 | 84,354 | → |
| Penafiel | Municipality | 71,800 | 72,265 | 69,629 | → |
| Porto | Municipality | 263,131 | 237,591 | 231,800 | → |
| Póvoa de Varzim | Municipality | 63,470 | 63,408 | 64,255 | → |
| Santo Tirso | Municipality | 72,396 | 71,530 | 67,709 | → |
| Trofa | Municipality | 37,581 | 38,999 | 38,548 | → |
| Valongo | Municipality | 86,005 | 93,858 | 94,672 | → |
| Vila do Conde | Municipality | 74,391 | 79,533 | 80,825 | → |
| Vila Nova de Gaia | Municipality | 288,749 | 302,298 | 303,824 | → |
| Portugal | Republic | 10,356,117 | 10,562,178 | 10,343,066 |
Source: Instituto Nacional de Estatística Portugal (web).
Further information about the population structure:
| Gender (C 2021) | |
|---|---|
| Males | 846,647 |
| Females | 938,758 |
| Age Groups (C 2021) | |
|---|---|
| 0-14 years | 227,234 |
| 15-64 years | 1,182,621 |
| 65+ years | 375,550 |
| Age Distribution (C 2021) | |
|---|---|
| 80+ years | 98,345 |
| 70-79 years | 166,261 |
| 60-69 years | 234,705 |
| 50-59 years | 272,328 |
| 40-49 years | 274,036 |
| 30-39 years | 216,621 |
| 20-29 years | 202,301 |
| 10-19 years | 178,629 |
| 0-9 years | 142,179 |
| Citizenship (C 2021) | |
|---|---|
| Portugal | 1,735,800 |
| EU | 7,424 |
| Europe (other) | 3,126 |
| Africa | 5,417 |
| America | 29,074 |
| Asia & Oceania | 4,547 |
| Country of Birth (C 2021) | |
|---|---|
| Portugal | 1,670,934 |
| EU | 23,448 |
| Europe (other) | 8,850 |
| Africa | 29,772 |
| America | 47,350 |
| Asia & Oceania | 5,051 |