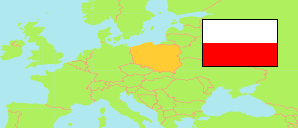
Powiat czarnkowsko-trzcianecki
County in Greater Poland Voivodeship
Contents: Subdivision
The population development in Powiat czarnkowsko-trzcianecki as well as related information and services (Wikipedia, Google, images).
| Name | Status | Population Census 2002-05-20 | Population Census 2011-03-31 | Population Census 2021-03-31 | |
|---|---|---|---|---|---|
| Powiat czarnkowsko-trzcianecki [Czarnków-Trzcianka County] | County | 85,881 | 88,304 | 85,094 | |
| Czarnków | Urban Commune | 11,588 | 11,543 | 10,370 | → |
| Czarnków (gm.w.) | Rural Commune | 10,796 | 11,054 | 11,121 | → |
| Drawsko | Rural Commune | 5,906 | 6,015 | 5,702 | → |
| Krzyż Wielkopolski | Urban-Rural Commune | 8,747 | 8,824 | 8,413 | → |
| Lubasz | Rural Commune | 6,702 | 7,337 | 7,543 | → |
| Połajewo | Rural Commune | 6,075 | 6,254 | 6,060 | → |
| Trzcianka | Urban-Rural Commune | 23,335 | 24,490 | 23,839 | → |
| Wieleń | Urban-Rural Commune | 12,732 | 12,787 | 12,046 | → |
| Wielkopolskie [Greater Poland] | Voivodeship | 3,351,915 | 3,447,441 | 3,504,579 |
Source: Główny Urząd Statystyczny, Warszawa (web).
Further information about the population structure:
| Gender (C 2021) | |
|---|---|
| Males | 42,288 |
| Females | 42,806 |
| Age Groups (C 2021) | |
|---|---|
| 0-17 years | 16,909 |
| 18-64 years | 53,357 |
| 65+ years | 14,828 |
| Age Distribution (C 2021) | |
|---|---|
| 90+ years | 535 |
| 80-89 years | 2,429 |
| 70-79 years | 6,341 |
| 60-69 years | 11,501 |
| 50-59 years | 10,479 |
| 40-49 years | 12,892 |
| 30-39 years | 12,568 |
| 20-29 years | 9,672 |
| 10-19 years | 9,688 |
| 0-9 years | 8,989 |
| Urbanization (C 2021) | |
|---|---|
| Rural | 45,998 |
| Urban | 39,096 |