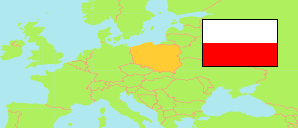
Powiat zawierciański
County in Silesia Voivodeship
Contents: Subdivision
The population development in Powiat zawierciański as well as related information and services (Wikipedia, Google, images).
| Name | Status | Population Census 2002-05-20 | Population Census 2011-03-31 | Population Census 2021-03-31 | |
|---|---|---|---|---|---|
| Powiat zawierciański [Zawiercie County] | County | 126,091 | 123,021 | 114,665 | |
| Irządze | Rural Commune | 2,987 | 2,811 | 2,542 | → |
| Kroczyce | Rural Commune | 6,128 | 6,315 | 6,138 | → |
| Łazy | Urban-Rural Commune | 16,111 | 16,207 | 15,737 | → |
| Ogrodzieniec | Urban-Rural Commune | 9,598 | 9,453 | 9,045 | → |
| Pilica | Urban-Rural Commune | 9,392 | 8,992 | 8,246 | → |
| Poręba | Urban Commune | 8,888 | 8,861 | 8,288 | → |
| Szczekociny | Urban-Rural Commune | 8,671 | 8,192 | 7,264 | → |
| Włodowice | Rural Commune | 5,254 | 5,271 | 5,210 | → |
| Żarnowiec | Rural Commune | 5,025 | 4,828 | 4,506 | → |
| Zawiercie | Urban Commune | 54,037 | 52,091 | 47,689 | → |
| Śląskie [Silesia] | Voivodeship | 4,742,874 | 4,630,364 | 4,402,950 |
Source: Główny Urząd Statystyczny, Warszawa (web).
Further information about the population structure:
| Gender (C 2021) | |
|---|---|
| Males | 55,330 |
| Females | 59,335 |
| Age Groups (C 2021) | |
|---|---|
| 0-17 years | 18,684 |
| 18-64 years | 70,623 |
| 65+ years | 25,358 |
| Age Distribution (C 2021) | |
|---|---|
| 90+ years | 837 |
| 80-89 years | 4,707 |
| 70-79 years | 10,982 |
| 60-69 years | 17,755 |
| 50-59 years | 14,846 |
| 40-49 years | 17,849 |
| 30-39 years | 15,868 |
| 20-29 years | 11,153 |
| 10-19 years | 10,767 |
| 0-9 years | 9,901 |
| Urbanization (C 2021) | |
|---|---|
| Rural | 42,649 |
| Urban | 72,016 |