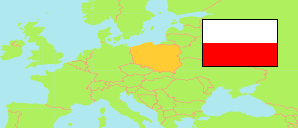
Powiat opolski
County in Opole Voivodeship
Contents: Subdivision
The population development in Powiat opolski as well as related information and services (Wikipedia, Google, images).
| Name | Status | Population Census 2002-05-20 | Population Census 2011-03-31 | Population Census 2021-03-31 | |
|---|---|---|---|---|---|
| Powiat opolski [Opole County] | County | ... | 123,895 | 121,025 | |
| Chrząstowice | Rural Commune | 6,639 | 6,683 | 6,975 | → |
| Dąbrowa | Rural Commune | ... | 8,016 | 8,123 | → |
| Dobrzeń Wielki | Rural Commune | ... | 9,324 | 9,176 | → |
| Komprachcice | Rural Commune | ... | 8,949 | 9,237 | → |
| Łubniany | Rural Commune | 9,077 | 9,506 | 9,959 | → |
| Murów | Rural Commune | 6,312 | 5,628 | 5,165 | → |
| Niemodlin | Urban-Rural Commune | 13,923 | 13,610 | 12,852 | → |
| Ozimek | Urban-Rural Commune | 21,641 | 20,185 | 18,612 | → |
| Popielów | Rural Commune | 8,682 | 8,263 | 7,771 | → |
| Prószków | Urban-Rural Commune | ... | 9,105 | 8,853 | → |
| Tarnów Opolski | Rural Commune | 10,292 | 9,724 | 9,402 | → |
| Tułowice | Urban-Rural Commune | 5,572 | 5,269 | 5,009 | → |
| Turawa | Rural Commune | 9,609 | 9,633 | 9,891 | → |
| Opolskie [Opole] | Voivodeship | 1,065,043 | 1,016,213 | 954,133 |
Source: Główny Urząd Statystyczny, Warszawa (web).
Further information about the population structure:
| Gender (C 2021) | |
|---|---|
| Males | 58,951 |
| Females | 62,074 |
| Age Groups (C 2021) | |
|---|---|
| 0-17 years | 20,714 |
| 18-64 years | 79,349 |
| 65+ years | 20,962 |
| Age Distribution (C 2021) | |
|---|---|
| 90+ years | 758 |
| 80-89 years | 4,953 |
| 70-79 years | 7,827 |
| 60-69 years | 16,002 |
| 50-59 years | 17,962 |
| 40-49 years | 19,470 |
| 30-39 years | 18,946 |
| 20-29 years | 12,224 |
| 10-19 years | 11,219 |
| 0-9 years | 11,664 |
| Urbanization (C 2021) | |
|---|---|
| Rural | 100,454 |
| Urban | 20,571 |