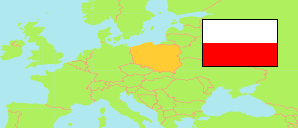
Powiat garwoliński
County in Mazovia Voivodeship
Contents: Subdivision
The population development in Powiat garwoliński as well as related information and services (Wikipedia, Google, images).
| Name | Status | Population Census 2002-05-20 | Population Census 2011-03-31 | Population Census 2021-03-31 | |
|---|---|---|---|---|---|
| Powiat garwoliński [Garwolin County] | County | 106,410 | 108,411 | 106,255 | |
| Borowie | Rural Commune | 5,144 | 5,233 | 4,975 | → |
| Garwolin | Urban Commune | 15,758 | 16,999 | 17,279 | → |
| Garwolin (gm.w.) | Rural Commune | 11,721 | 12,572 | 13,321 | → |
| Górzno | Rural Commune | 6,176 | 6,304 | 6,635 | → |
| Łaskarzew | Urban Commune | 4,924 | 4,954 | 4,575 | → |
| Łaskarzew (gm.w.) | Rural Commune | 5,479 | 5,439 | 5,311 | → |
| Maciejowice | Rural Commune | 7,489 | 7,307 | 6,565 | → |
| Miastków Kościelny | Rural Commune | 5,127 | 5,048 | 4,653 | → |
| Parysów | Rural Commune | 4,143 | 4,115 | 4,144 | → |
| Pilawa | Urban-Rural Commune | 10,408 | 10,685 | 10,658 | → |
| Sobolew | Rural Commune | 8,298 | 8,326 | 7,916 | → |
| Trojanów | Rural Commune | 7,942 | 7,582 | 7,159 | → |
| Wilga | Rural Commune | 5,253 | 5,352 | 5,126 | → |
| Żelechów | Urban-Rural Commune | 8,548 | 8,495 | 7,938 | → |
| Mazowieckie [Mazovia] | Voivodeship | 5,124,018 | 5,268,660 | 5,514,699 |
Source: Główny Urząd Statystyczny, Warszawa (web).
Further information about the population structure:
| Gender (C 2021) | |
|---|---|
| Males | 52,686 |
| Females | 53,569 |
| Age Groups (C 2021) | |
|---|---|
| 0-17 years | 23,477 |
| 18-64 years | 65,429 |
| 65+ years | 17,349 |
| Age Distribution (C 2021) | |
|---|---|
| 90+ years | 764 |
| 80-89 years | 3,512 |
| 70-79 years | 7,015 |
| 60-69 years | 12,840 |
| 50-59 years | 12,443 |
| 40-49 years | 14,915 |
| 30-39 years | 15,736 |
| 20-29 years | 13,159 |
| 10-19 years | 12,572 |
| 0-9 years | 13,299 |
| Urbanization (C 2021) | |
|---|---|
| Rural | 76,187 |
| Urban | 30,068 |