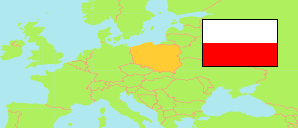
Powiat nowotarski
County in Lesser Poland Voivodeship
Contents: Subdivision
The population development in Powiat nowotarski as well as related information and services (Wikipedia, Google, images).
| Name | Status | Population Census 2002-05-20 | Population Census 2011-03-31 | Population Census 2021-03-31 | |
|---|---|---|---|---|---|
| Powiat nowotarski [Nowy Targ County] | County | 178,782 | 187,982 | 190,532 | |
| Czarny Dunajec | Rural Commune | 20,785 | 21,884 | 22,120 | → |
| Czorsztyn | Rural Commune | 6,991 | 7,375 | 7,639 | → |
| Jabłonka | Rural Commune | 16,524 | 17,707 | 18,892 | → |
| Krościenko nad Dunajcem | Rural Commune | 6,296 | 6,646 | 6,742 | → |
| Łapsze Niżne | Rural Commune | 8,690 | 9,051 | 9,235 | → |
| Lipnica Wielka | Rural Commune | 5,463 | 5,907 | 6,107 | → |
| Nowy Targ | Urban Commune | 33,034 | 33,812 | 33,273 | → |
| Nowy Targ (gm.w.) | Rural Commune | 21,563 | 23,172 | 24,075 | → |
| Ochotnica Dolna | Rural Commune | 7,794 | 8,251 | 8,423 | → |
| Raba Wyżna | Rural Commune | 13,187 | 14,306 | 14,568 | → |
| Rabka-Zdrój | Urban-Rural Commune | 17,228 | 17,527 | 16,796 | → |
| Spytkowice | Rural Commune | 3,919 | 4,335 | 4,629 | → |
| Szaflary | Rural Commune | 9,967 | 10,600 | 11,114 | → |
| Szczawnica | Urban-Rural Commune | 7,341 | 7,409 | 6,919 | → |
| Małopolskie [Lesser Poland] | Voivodeship | 3,240,730 | 3,337,471 | 3,432,295 |
Source: Główny Urząd Statystyczny, Warszawa (web).
Further information about the population structure:
| Gender (C 2021) | |
|---|---|
| Males | 93,076 |
| Females | 97,456 |
| Age Groups (C 2021) | |
|---|---|
| 0-17 years | 39,554 |
| 18-64 years | 121,291 |
| 65+ years | 29,687 |
| Age Distribution (C 2021) | |
|---|---|
| 90+ years | 1,058 |
| 80-89 years | 6,657 |
| 70-79 years | 12,289 |
| 60-69 years | 20,779 |
| 50-59 years | 23,961 |
| 40-49 years | 27,459 |
| 30-39 years | 29,356 |
| 20-29 years | 25,110 |
| 10-19 years | 22,471 |
| 0-9 years | 21,392 |
| Urbanization (C 2021) | |
|---|---|
| Rural | 139,326 |
| Urban | 51,206 |