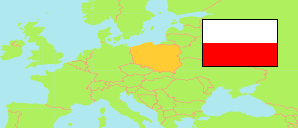
Powiat lubartowski
County in Lublin Voivodeship
Contents: Subdivision
The population development in Powiat lubartowski as well as related information and services (Wikipedia, Google, images).
| Name | Status | Population Census 2002-05-20 | Population Census 2011-03-31 | Population Census 2021-03-31 | |
|---|---|---|---|---|---|
| Powiat lubartowski [Lubartów County] | County | 91,482 | 90,459 | 85,762 | |
| Abramów | Rural Commune | 4,446 | 4,252 | 3,909 | → |
| Firlej | Rural Commune | 6,317 | 6,057 | 5,778 | → |
| Jeziorzany | Rural Commune | 3,067 | 2,992 | 2,565 | → |
| Kamionka | Urban-Rural Commune | 6,557 | 6,439 | 6,462 | → |
| Kock | Urban-Rural Commune | 6,938 | 6,807 | 5,911 | → |
| Lubartów | Urban Commune | 23,166 | 22,773 | 20,494 | → |
| Lubartów (gm.w.) | Rural Commune | 9,778 | 10,845 | 12,024 | → |
| Michów | Rural Commune | 6,582 | 6,187 | 5,652 | → |
| Niedźwiada | Rural Commune | 6,374 | 6,326 | 6,219 | → |
| Ostrówek | Rural Commune | 4,259 | 4,059 | 3,766 | → |
| Ostrów Lubelski | Urban-Rural Commune | 5,618 | 5,473 | 5,096 | → |
| Serniki | Rural Commune | 4,910 | 4,876 | 4,831 | → |
| Uścimów | Rural Commune | 3,470 | 3,373 | 3,055 | → |
| Lubelskie [Lublin] | Voivodeship | 2,199,054 | 2,175,700 | 2,052,340 |
Source: Główny Urząd Statystyczny, Warszawa (web).
Further information about the population structure:
| Gender (C 2021) | |
|---|---|
| Males | 41,937 |
| Females | 43,825 |
| Age Groups (C 2021) | |
|---|---|
| 0-17 years | 16,162 |
| 18-64 years | 53,572 |
| 65+ years | 16,028 |
| Age Distribution (C 2021) | |
|---|---|
| 90+ years | 682 |
| 80-89 years | 3,166 |
| 70-79 years | 6,658 |
| 60-69 years | 11,284 |
| 50-59 years | 10,603 |
| 40-49 years | 12,724 |
| 30-39 years | 12,760 |
| 20-29 years | 9,920 |
| 10-19 years | 9,480 |
| 0-9 years | 8,485 |
| Urbanization (C 2021) | |
|---|---|
| Rural | 58,520 |
| Urban | 27,242 |