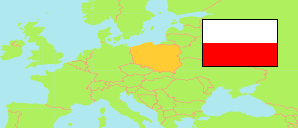
Podlaskie
Voivodeship in Poland
Contents: Subdivision
The population development in Podlaskie as well as related information and services (Wikipedia, Google, images).
| Name | Status | Population Census 2002-05-20 | Population Census 2011-03-31 | Population Census 2021-03-31 | Population Estimate 2023-12-31 | |
|---|---|---|---|---|---|---|
| Podlaskie [Podlachia] | Voivodeship | 1,208,606 | 1,202,365 | 1,154,283 | 1,138,216 | |
| Powiat augustowski [Augustów County] | County | 59,190 | 60,044 | 55,773 | 54,449 | → |
| Powiat białostocki [Białystok County] | County | 138,456 | 142,828 | 154,255 | 157,896 | → |
| Powiat Białystok | Urban County | 291,383 | 294,001 | 294,242 | 291,688 | → |
| Powiat bielski [Bielsk County] | County | 61,613 | 58,813 | 52,427 | 50,596 | → |
| Powiat grajewski [Grajewo County] | County | 50,934 | 49,659 | 45,481 | 44,222 | → |
| Powiat hajnowski [Hajnówka County] | County | 50,222 | 46,967 | 40,439 | 38,817 | → |
| Powiat kolneński [Kolno County] | County | 40,388 | 40,124 | 36,374 | 35,702 | → |
| Powiat Łomża | Urban County | 63,936 | 63,203 | 60,848 | 59,711 | → |
| Powiat łomżyński [Łomża County] | County | 50,928 | 52,201 | 49,954 | 49,608 | → |
| Powiat moniecki [Mońki County] | County | 44,242 | 42,951 | 38,490 | 37,358 | → |
| Powiat sejneński [Sejny County] | County | 21,676 | 21,139 | 19,184 | 18,645 | → |
| Powiat siemiatycki [Siemiatycze County] | County | 50,546 | 48,067 | 42,159 | 40,636 | → |
| Powiat sokólski [Sokółka County] | County | 74,973 | 72,120 | 63,445 | 61,246 | → |
| Powiat Suwałki | Urban County | 68,923 | 69,239 | 69,229 | 68,231 | → |
| Powiat suwalski [Suwałki County] | County | 35,526 | 36,207 | 35,028 | 34,635 | → |
| Powiat wysokomazowiecki [Wysokie Mazowieckie County] | County | 60,378 | 59,661 | 54,856 | 53,406 | → |
| Powiat zambrowski [Zambrów County] | County | 45,292 | 45,141 | 42,099 | 41,370 | → |
| Polska [Poland] | Republic | 38,230,080 | 38,511,824 | 38,036,118 | 37,636,508 |
Source: Główny Urząd Statystyczny, Warszawa.
Further information about the population structure:
| Gender (E 2023) | |
|---|---|
| Males | 553,557 |
| Females | 584,659 |
| Age Groups (E 2023) | |
|---|---|
| 0-17 years | 205,399 |
| 18-64 years | 705,979 |
| 65+ years | 226,838 |
| Age Distribution (E 2023) | |
|---|---|
| 80+ years | 55,368 |
| 70-79 years | 95,790 |
| 60-69 years | 153,113 |
| 50-59 years | 147,923 |
| 40-49 years | 173,623 |
| 30-39 years | 166,274 |
| 20-29 years | 119,277 |
| 10-19 years | 117,393 |
| 0-9 years | 109,455 |
| Urbanization (E 2023) | |
|---|---|
| Rural | 446,083 |
| Urban | 692,133 |
| Citizenship (C 2021) | |
|---|---|
| Poland | 1,150,064 |
| Other Citizenship | 4,205 |
| Country of Birth (C 2021) | |
|---|---|
| Poland | 1,124,185 |
| Other country | 29,469 |