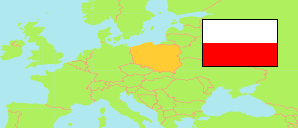
Opolskie
Voivodeship in Poland
Contents: Subdivision
The population development in Opolskie as well as related information and services (Wikipedia, Google, images).
| Name | Status | Population Census 2002-05-20 | Population Census 2011-03-31 | Population Census 2021-03-31 | Population Estimate 2023-12-31 | |
|---|---|---|---|---|---|---|
| Opolskie [Opole] | Voivodeship | 1,065,043 | 1,016,213 | 954,133 | 936,725 | |
| Powiat brzeski [Brzeg County] | County | 92,857 | 92,505 | 87,875 | 86,149 | → |
| Powiat głubczycki [Głubczyce County] | County | 51,795 | 48,453 | 43,854 | 42,608 | → |
| Powiat kędzierzyńsko-kozielski [Kędzierzyn-Koźle County] | County | 104,728 | 98,701 | 89,135 | 86,161 | → |
| Powiat kluczborski [Kluczbork County] | County | 71,464 | 68,040 | 62,729 | 61,236 | → |
| Powiat krapkowicki [Krapkowice County] | County | 70,081 | 65,871 | 60,611 | 59,647 | → |
| Powiat namysłowski [Namysłów County] | County | 44,481 | 43,185 | 42,378 | 42,033 | → |
| Powiat nyski [Nysa County] | County | 148,059 | 142,581 | 131,617 | 127,992 | → |
| Powiat oleski [Olesno County] | County | 69,981 | 66,288 | 62,192 | 61,281 | → |
| Powiat Opole | Urban County | ... | 131,867 | 127,387 | 126,077 | → |
| Powiat opolski [Opole County] | County | ... | 123,895 | 121,025 | 120,841 | → |
| Powiat prudnicki [Prudnik County] | County | 61,897 | 57,838 | 53,018 | 51,443 | → |
| Powiat strzelecki [Strzelce County] | County | 83,182 | 76,989 | 72,312 | 71,257 | → |
| Polska [Poland] | Republic | 38,230,080 | 38,511,824 | 38,036,118 | 37,636,508 |
Source: Główny Urząd Statystyczny, Warszawa.
Further information about the population structure:
| Gender (E 2023) | |
|---|---|
| Males | 452,531 |
| Females | 484,194 |
| Age Groups (E 2023) | |
|---|---|
| 0-17 years | 154,619 |
| 18-64 years | 586,571 |
| 65+ years | 195,535 |
| Age Distribution (E 2023) | |
|---|---|
| 80+ years | 44,718 |
| 70-79 years | 86,217 |
| 60-69 years | 130,720 |
| 50-59 years | 127,133 |
| 40-49 years | 151,999 |
| 30-39 years | 135,432 |
| 20-29 years | 89,591 |
| 10-19 years | 89,443 |
| 0-9 years | 81,472 |
| Urbanization (E 2023) | |
|---|---|
| Rural | 442,696 |
| Urban | 494,029 |
| Citizenship (C 2021) | |
|---|---|
| Poland | 951,547 |
| Other Citizenship | 2,568 |
| Country of Birth (C 2021) | |
|---|---|
| Poland | 924,420 |
| Other country | 29,011 |