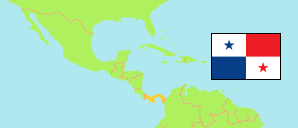
Panamá
Province in Panama
Contents: Subdivision
The population development in Panamá as well as related information and services (Wikipedia, Google, images).
| Name | Status | Population Census 2000-05-14 | Population Census 2010-05-16 | Population Census 2023-01-08 | |
|---|---|---|---|---|---|
| Panamá | Province | 1,045,507 | 1,249,032 | 1,439,575 | |
| Balboa | District | 2,336 | 2,721 | 1,989 | → |
| Chepo | District | 35,500 | 46,139 | 65,588 | → |
| Chimán | District | 4,086 | 3,343 | 3,142 | → |
| Panamá | District | 708,438 | 880,691 | 1,086,990 | → |
| San Miguelito | District | 293,745 | 315,019 | 280,777 | → |
| Taboga | District | 1,402 | 1,119 | 1,089 | → |
| Panamá | Republic | 2,839,177 | 3,405,813 | 4,202,572 |
Source: Instituto Nacional de Estadística y Censo, Panamá.
Explanation: The tabulated census results are not adjusted for underenumeration. The 2023 total population includes 137,792 persons taken from administrative registers; they are not included in the province and districts figures. Area figures of districts are computed using geospatial data.
Further information about the population structure:
| Gender (C 2023) | |
|---|---|
| Males | 704,358 |
| Females | 735,217 |
| Age Groups (C 2023) | |
|---|---|
| 0-14 years | 319,513 |
| 15-64 years | 977,496 |
| 65+ years | 142,277 |
| Age Distribution (C 2023) | |
|---|---|
| 90+ years | 6,140 |
| 80-89 years | 25,234 |
| 70-79 years | 63,321 |
| 60-69 years | 108,170 |
| 50-59 years | 162,971 |
| 40-49 years | 197,603 |
| 30-39 years | 221,476 |
| 20-29 years | 229,086 |
| 10-19 years | 217,699 |
| 0-9 years | 207,586 |
| Urbanization (C 2023) | |
|---|---|
| Rural | 87,474 |
| Urban | 1,352,101 |
| Ethnic Group (C 2023) | |
|---|---|
| Ngäbe | 34,376 |
| Guna | 35,897 |
| Other Indigenous | 52,722 |
| African, Not Indigenous | 500,458 |
| Not African, Not Indigenous | 815,212 |