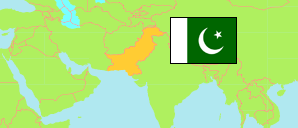
Haripur
District in Pakistan
Contents: Population
The population development of Haripur as well as related information and services (Wikipedia, Google, images).
| Name | Status | Population Census 1972-09-16 | Population Census 1981-03-01 | Population Census 1998-03-01 | Population Census 2017-03-15 | Population Census 2023-03-01 | |
|---|---|---|---|---|---|---|---|
| Haripur | District | 417,561 | 479,031 | 692,228 | 1,001,515 | 1,174,783 | |
| Pakistan | Republic | 65,309,340 | 84,253,644 | 132,352,279 | 207,684,626 | 241,499,431 |
Source: Pakistan Bureau of Statistics, U.S. Bureau of Census: Demobase Pakistan.
Explanation: The Pakistani-administered parts of Kashmir are not tabulated.
Further information about the population structure:
| Gender (C 2017) | |
|---|---|
| Males | 498,202 |
| Females | 503,266 |
| Transgender | 47 |
| Age Groups (C 2017) | |
|---|---|
| 0-14 years | 354,500 |
| 15-64 years | 596,954 |
| 65+ years | 50,061 |
| Age Distribution (C 2017) | |
|---|---|
| 0-9 years | 249,485 |
| 10-19 years | 204,514 |
| 20-29 years | 172,624 |
| 30-39 years | 136,042 |
| 40-49 years | 93,402 |
| 50-59 years | 68,225 |
| 60-69 years | 46,730 |
| 70+ years | 30,493 |
| Urbanization (C 2017) | |
|---|---|
| Rural | 868,415 |
| Urban | 133,100 |
| Literacy (A10+) (C 2017) | |
|---|---|
| yes | 543,004 |
| no | 209,026 |
| Mother Tongue (C 2017) | |
|---|---|
| Urdu | 18,309 |
| Punjabi | 15,145 |
| Sindhi | 1,787 |
| Pushto | 118,628 |
| Balochi | 2,079 |
| Kashmiri | 5,301 |
| Saraiki | 2,023 |
| Hindko | 809,613 |
| Brahvi | 7,657 |
| Other Language | 20,973 |