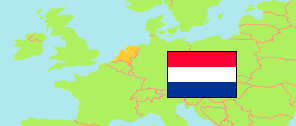
Harlingen
Municipality in Friesland (Netherlands)
Contents: Population
The population development of Harlingen as well as related information and services (Wikipedia, Google, images).
| Name | Status | Population Census 2001-01-01 | Population Estimate 2008-01-01 | Population Estimate 2011-01-01 | Population Estimate 2018-01-01 | Population Estimate 2024-01-01 | |
|---|---|---|---|---|---|---|---|
| Harlingen | Municipality | 15,444 | 15,567 | 15,878 | 15,783 | 16,212 | |
| Nederland [Netherlands] | Country | 15,985,538 | 16,405,399 | 16,655,799 | 17,181,084 | 17,947,684 |
Source: Statistics Netherlands.
Explanation: Provinces and municipalities in the boundaries of 1 January 2024. 2024 population figures are preliminary.
Further information about the population structure:
| Gender (E 2023) | |
|---|---|
| Males | 8,115 |
| Females | 8,073 |
| Age Groups (E 2023) | |
|---|---|
| 0-17 years | 2,892 |
| 18-64 years | 9,005 |
| 65+ years | 4,291 |
| Age Distribution (E 2023) | |
|---|---|
| 90+ years | 109 |
| 80-89 years | 881 |
| 70-79 years | 2,177 |
| 60-69 years | 2,286 |
| 50-59 years | 2,473 |
| 40-49 years | 1,795 |
| 30-39 years | 1,608 |
| 20-29 years | 1,574 |
| 10-19 years | 1,879 |
| 0-9 years | 1,406 |
| Urbanization (E 2023) | |
|---|---|
| Strongly urbanized | 1,670 |
| Moderately urbanized | 9,450 |
| Lowly urbanized | 3,580 |
| Rural | 1,490 |
| Citizenhip (E 2023) | |
|---|---|
| Netherlands | 15,539 |
| European Union | 286 |
| Europe (Rest) | 172 |
| Other country | 191 |
| Birth Country (E 2023) | |
|---|---|
| Netherlands | 14,863 |
| Other country | 1,325 |