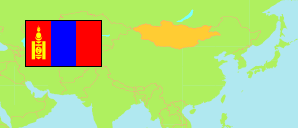
Dornogov'
Province in Mongolia
Contents: Subdivision
The population development in Dornogov' as well as related information and services (Wikipedia, Google, images).
| Name | Status | Native | Population Estimate 1990-12-31 | Population Estimate 2000-12-31 | Population Estimate 2010-12-31 | Population Estimate 2020-12-31 | Population Estimate 2021-12-31 | |
|---|---|---|---|---|---|---|---|---|
| Dornogov' [Dornogovi] | Province | Дорноговь | 55,180 | 50,875 | 58,177 | 71,233 | 72,113 | |
| Ajrag [Airag] | District | Айраг | 3,006 | 3,425 | 3,452 | 3,657 | 3,598 | → |
| Altanširėė [Altanshiree] | District | Алтанширээ | 1,532 | 1,654 | 1,301 | 1,364 | 1,533 | → |
| Chatanbulag [Khatanbulag] | District | Хатанбулаг | 2,761 | 3,261 | 2,984 | 2,962 | 3,007 | → |
| Chövsgöl [Khövsgöl] | District | Хөвсгөл | 1,434 | 1,732 | 1,548 | 1,588 | 1,534 | → |
| Dalanjargalan | District | Даланжаргалан | 2,183 | 2,282 | 2,489 | 3,023 | 2,983 | → |
| Dėlgėrėch [Delgerekh] | District | Дэлгэрэх | 1,769 | 2,001 | 1,769 | 1,880 | 1,918 | → |
| Ėrdėnė [Erdene] | District | Эрдэнэ | 2,094 | 2,697 | 2,509 | 2,341 | 2,418 | → |
| Ichchėt [Ikhkhet] | District | Иххэт | 1,210 | 2,721 | 2,093 | 2,085 | 2,087 | → |
| Mandach [Mandakh] | District | Мандах | 1,743 | 1,952 | 1,497 | 1,573 | 1,550 | → |
| Örgön | District | Өргөн | 1,748 | 2,044 | 1,841 | 2,193 | 2,155 | → |
| Sajchandulaan [Saikhandulaan] | District | Сайхандулаан | 1,407 | 1,312 | 1,232 | 1,384 | 1,411 | → |
| Sajnšand [Sainshand] | District | Сайншанд | 31,477 | 17,648 | 20,526 | 26,558 | 27,405 | → |
| Ulaanbadrach [Ulaanbadrakh] | District | Улаанбадрах | 1,484 | 1,793 | 1,534 | 1,509 | 1,519 | → |
| Zamyn-Üüd | District | Замын-Үүд | 1,332 | 6,353 | 13,402 | 19,116 | 18,995 | → |
| Mongol uls [Mongolia] | State | Монгол улс | 2,050,044 | 2,374,617 | 2,653,828 | 3,253,283 | 3,312,275 |
Source: Mongolian National Statistical Office (web).
Explanation: Population figures refer to the resident population which excludes citizens living abroad for more than six months and includes foreign and stateless people living for more than six months in Mongolia. Area and density figures of districts computed by using geospatial data.
Further information about the population structure:
| Gender (E 2021) | |
|---|---|
| Males | 36,449 |
| Females | 35,664 |
| Age Groups (E 2021) | |
|---|---|
| 0-14 years | 23,157 |
| 15-64 years | 46,056 |
| 65+ years | 2,900 |
| Age Distribution (E 2021) | |
|---|---|
| 0-9 years | 16,149 |
| 10-19 years | 12,040 |
| 20-29 years | 10,293 |
| 30-39 years | 12,308 |
| 40-49 years | 9,493 |
| 50-59 years | 6,664 |
| 60-69 years | 3,609 |
| 70+ years | 1,557 |
| Urbanization (E 2021) | |
|---|---|
| Rural | 25,713 |
| Urban | 46,400 |