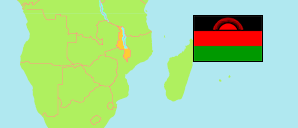
Chikwawa
District in Malawi
Contents: Population
The population development of Chikwawa as well as related information and services (Wikipedia, Google, images).
| Name | Status | Population Census 1977-09-20 | Population Census 1987-09-01 | Population Census 1998-09-01 | Population Census 2008-06-08 | Population Census 2018-09-03 | Population Projection 2023-09-03 | |
|---|---|---|---|---|---|---|---|---|
| Chikwawa | District | 194,425 | 316,733 | 356,682 | 437,892 | 564,684 | 628,282 | |
| Malawi | Republic | 5,547,460 | 7,988,507 | 9,933,868 | 13,029,498 | 17,563,749 | 19,809,511 |
Source: National Statistical Office of Malawi.
Explanation: Population figures until 1998 are de facto, later figures are de jure.
Further information about the population structure:
| Gender (P 2023) | |
|---|---|
| Males | 306,517 |
| Females | 321,765 |
| Age Groups (P 2023) | |
|---|---|
| 0-14 years | 267,403 |
| 15-64 years | 338,755 |
| 65+ years | 22,125 |
| Age Distribution (P 2023) | |
|---|---|
| 0-9 years | 193,169 |
| 10-19 years | 143,447 |
| 20-29 years | 109,647 |
| 30-39 years | 72,086 |
| 40-49 years | 49,065 |
| 50-59 years | 29,510 |
| 60-69 years | 16,291 |
| 70-79 years | 9,960 |
| 80+ years | 5,108 |
| Urbanization (C 2018) | |
|---|---|
| Rural | 551,538 |
| Urban | 13,146 |
| Citizenship (C 2018) | |
|---|---|
| Malawi | 564,099 |
| Foreign Citizenship | 585 |
| Country of Birth (C 2018) | |
|---|---|
| Malawi | 561,479 |
| Other Country | 3,205 |
| Religion (C 2018) | |
|---|---|
| Christian | 489,843 |
| Muslim | 9,451 |
| Traditional | 2,131 |
| Other religion | 44,841 |
| No religion | 18,418 |
| Literacy (A5+) (C 2018) | |
|---|---|
| yes | 275,044 |
| no | 202,860 |
| Tribe (C 2018) | |
|---|---|
| Chewa | 41,664 |
| Tumbuka | 2,281 |
| Lomwe | 41,207 |
| Yao | 6,291 |
| Ngoni | 8,173 |
| Sena | 274,356 |
| Mang'anja | 172,409 |
| Other Tribe | 17,718 |