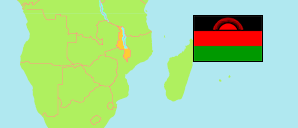
Lilongwe
District in Malawi
Contents: Population
The population development of Lilongwe as well as related information and services (Wikipedia, Google, images).
| Name | Status | Population Census 1977-09-20 | Population Census 1987-09-01 | Population Census 1998-09-01 | Population Census 2008-06-08 | Population Census 2018-09-03 | Population Projection 2023-09-03 | |
|---|---|---|---|---|---|---|---|---|
| Lilongwe | District | 605,399 | 753,309 | 905,889 | 1,232,972 | 1,637,583 | 1,830,619 | |
| Malawi | Republic | 5,547,460 | 7,988,507 | 9,933,868 | 13,029,498 | 17,563,749 | 19,809,511 |
Source: National Statistical Office of Malawi.
Explanation: Population figures until 1998 are de facto, later figures are de jure.
Further information about the population structure:
| Gender (P 2023) | |
|---|---|
| Males | 888,253 |
| Females | 942,366 |
| Age Groups (P 2023) | |
|---|---|
| 0-14 years | 743,159 |
| 15-64 years | 1,016,182 |
| 65+ years | 71,277 |
| Age Distribution (P 2023) | |
|---|---|
| 0-9 years | 509,873 |
| 10-19 years | 438,108 |
| 20-29 years | 318,047 |
| 30-39 years | 218,179 |
| 40-49 years | 152,745 |
| 50-59 years | 92,799 |
| 60-69 years | 52,856 |
| 70-79 years | 31,646 |
| 80+ years | 16,365 |
| Urbanization (C 2018) | |
|---|---|
| Rural | 1,637,583 |
| Citizenship (C 2018) | |
|---|---|
| Malawi | 1,635,620 |
| Foreign Citizenship | 1,963 |
| Country of Birth (C 2018) | |
|---|---|
| Malawi | 1,633,751 |
| Other Country | 3,832 |
| Religion (C 2018) | |
|---|---|
| Christian | 1,329,170 |
| Muslim | 27,992 |
| Traditional | 45,154 |
| Other religion | 111,297 |
| No religion | 123,970 |
| Literacy (A5+) (C 2018) | |
|---|---|
| yes | 858,803 |
| no | 537,507 |
| Tribe (C 2018) | |
|---|---|
| Chewa | 1,545,939 |
| Tumbuka | 7,356 |
| Lomwe | 16,450 |
| Yao | 23,754 |
| Ngoni | 33,595 |
| Sena | 2,052 |
| Mang'anja | 2,034 |
| Other Tribe | 4,440 |