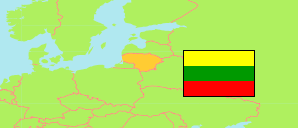
Šilalė
District Municipality in Lithuania
Contents: Population
The population development of Šilalė as well as related information and services (Wikipedia, Google, images).
| Name | Status | Population Census 2001-04-06 | Population Census 2011-04-05 | Population Census 2021-01-01 | Population Estimate 2024-01-01 | |
|---|---|---|---|---|---|---|
| Šilalė | District Municipality | 31,570 | 26,520 | 22,051 | 20,861 | |
| Lietuva [Lithuania] | Republic | 3,483,972 | 3,043,429 | 2,810,761 | 2,886,515 |
Source: Department of Statistics, Republic of Lithuania.
Explanation: The tabulated population estimates are preliminary.
Further information about the population structure:
| Gender (E 2024) | |
|---|---|
| Males | 10,062 |
| Females | 10,799 |
| Age Groups (E 2024) | |
|---|---|
| 0-17 years | 3,466 |
| 18-64 years | 13,051 |
| 65+ years | 4,344 |
| Age Distribution (E 2024) | |
|---|---|
| 80+ years | 1,215 |
| 70-79 years | 1,755 |
| 60-69 years | 3,173 |
| 50-59 years | 3,338 |
| 40-49 years | 2,423 |
| 30-39 years | 2,507 |
| 20-29 years | 2,533 |
| 10-19 years | 2,185 |
| 0-9 years | 1,732 |
| Urbanization (E 2024) | |
|---|---|
| Rural | 16,256 |
| Urban | 4,605 |
| Citizenship (C 2021) | |
|---|---|
| Lithuania | 22,018 |
| Several Citizenships | 22 |
| Other Citizenship | 11 |
| Country of Birth (C 2021) | |
|---|---|
| Lithuania | 21,719 |
| Other Country | 332 |
| Ethnic Group (C 2021) | |
|---|---|
| Lithuanians | 21,794 |
| Poles | 10 |
| Russians | 43 |
| Ukrainians | 6 |
| Belarusians | 4 |
| Other Ethnic Group | 9 |
| Religion (C 2021) | |
|---|---|
| Catholic | 20,167 |
| Orthodox | 41 |
| Other Religion | 184 |
| No Religion | 423 |