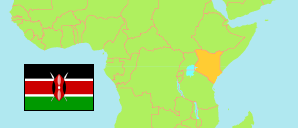
Siaya
County in Kenya
Contents: Population
The population development of Siaya as well as related information and services (Wikipedia, Google, images).
| Name | Status | Population Census 1979-08-24 | Population Census 1989-08-24 | Population Census 1999-08-24 | Population Census 2009-08-24 | Population Census 2019-08-24 | Population Projection 2023-07-01 | |
|---|---|---|---|---|---|---|---|---|
| Siaya | County | 474,516 | 639,439 | 718,964 | 842,304 | 993,183 | 1,059,458 | |
| Kenya | Republic | 15,327,061 | 21,443,636 | 28,686,607 | 38,610,097 | 47,564,296 | 51,525,602 |
Source: Kenya National Bureau of Statistics.
Further information about the population structure:
| Gender (P 2023) | |
|---|---|
| Males | 534,684 |
| Females | 524,773 |
| Age Groups (P 2023) | |
|---|---|
| 0-14 years | 403,845 |
| 15-64 years | 604,671 |
| 65+ years | 50,943 |
| Age Distribution (P 2023) | |
|---|---|
| 80+ years | 13,942 |
| 70-79 years | 22,928 |
| 60-69 years | 30,000 |
| 50-59 years | 38,738 |
| 40-49 years | 67,602 |
| 30-39 years | 141,859 |
| 20-29 years | 216,187 |
| 10-19 years | 255,000 |
| 0-9 years | 273,203 |
| Urbanization (C 2019) | |
|---|---|
| Rural | 907,766 |
| Urban | 85,417 |
| Religion (C 2019) | |
|---|---|
| Catholic s | 226,455 |
| Protestants | 224,860 |
| Evangelicals | 225,650 |
| Other Christians | 278,285 |
| Muslims | 4,994 |
| Hindus | 25 |
| Traditional religion | 2,526 |
| Other religion | 16,993 |
| No Religion | 8,614 |