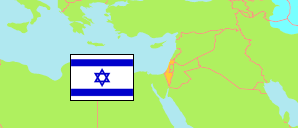
Tel Aviv
District in Israel
Contents: Subdivision
The population development in Tel Aviv as well as related information and services (Wikipedia, Google, images).
| Name | Status | Native | Population Census 1983-06-04 | Population Census 1995-11-04 | Population Census 2008-12-27 | Population Estimate 2013-12-31 | Population Estimate 2021-12-31 | |
|---|---|---|---|---|---|---|---|---|
| Tel Aviv | District | מחוז תל אביב | 1,000,200 | 1,158,000 | 1,258,800 | 1,331,300 | 1,481,400 | |
| Azor | Local Council Area | אזור | 6,710 | 8,321 | 10,600 | 11,840 | 13,474 | → |
| Bat Yam | City | בת ים | 128,738 | 136,416 | 130,300 | 128,871 | 126,290 | → |
| Bene Beraq [Bnei Brak] | City | בני ברק | 96,150 | 129,661 | 151,800 | 172,485 | 212,395 | → |
| Giv'atayim | City | גבעתיים | 46,744 | 48,851 | 52,100 | 56,159 | 61,281 | → |
| Herzliyya [Herzliya] | City | הרצליה | 63,155 | 82,759 | 86,300 | 89,813 | 103,318 | → |
| Holon | City | חולון | 133,460 | 163,082 | 176,300 | 186,399 | 197,464 | → |
| Kefar Shemaryahu [Kfar Shmaryahu] | Local Council Area | כפר שמריהו | 1,500 | 1,800 | 1,700 | 1,799 | 1,948 | → |
| Or Yehuda | City | אור יהודה | 19,259 | 23,132 | 33,900 | 35,526 | 36,815 | → |
| Qiryat Ono [Kiryat Ono] | City | קריית אונו | 21,770 | 23,813 | 30,000 | 35,546 | 41,900 | → |
| Ramat Gan | City | רמת גן | 117,072 | 127,985 | 143,600 | 149,594 | 169,706 | → |
| Ramat HaSharon | City | רמת השרון | 32,485 | 36,285 | 39,000 | 43,847 | 47,970 | → |
| Tel Aviv-Yafo [Tel Aviv-Jaffa] | City | תל אביב-יפו | 327,265 | 348,245 | 402,600 | 418,590 | 467,875 | → |
| Jisra'el [Israel] | State | ישראל | 4,037,400 | 5,643,500 | 7,412,200 | 8,134,500 | 9,452,975 |
Source: Central Bureau of Statistics, The State of Israel.
Explanation: The population structure information does not consider people living outside of localities.