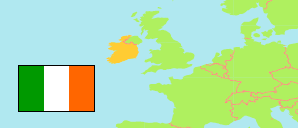
Ulster (part of)
Province in Ireland
Contents: Subdivision
The population development in Ulster (part of) as well as related information and services (Wikipedia, Google, images).
| Name | Status | Population Census 1981-04-05 | Population Census 1986-04-13 | Population Census 1991-04-21 | Population Census 1996-04-28 | Population Census 2002-04-28 | Population Census 2006-04-23 | Population Census 2011-04-10 | Population Census 2016-04-24 | Population Census 2022-04-03 | |
|---|---|---|---|---|---|---|---|---|---|---|---|
| Ulster (part of) | Province | 230,159 | 236,008 | 232,206 | 234,251 | 246,714 | 267,264 | 294,803 | 296,754 | 314,076 | |
| Cavan | County | 53,855 | 53,965 | 52,796 | 52,944 | 56,546 | 64,003 | 73,183 | 76,176 | 81,704 | → |
| Donegal | County | 125,112 | 129,664 | 128,117 | 129,994 | 137,575 | 147,264 | 161,137 | 159,192 | 167,084 | → |
| Monaghan | County | 51,192 | 52,379 | 51,293 | 51,313 | 52,593 | 55,997 | 60,483 | 61,386 | 65,288 | → |
| Ireland (Éire) | Republic | 3,443,405 | 3,540,643 | 3,525,719 | 3,626,087 | 3,917,203 | 4,239,848 | 4,588,252 | 4,761,865 | 5,149,139 |
Source: Central Statistics Office, Ireland.
Further information about the population structure:
| Gender (C 2022) | |
|---|---|
| Males | 156,749 |
| Females | 157,327 |
| Age Groups (C 2022) | |
|---|---|
| 0-17 years | 79,920 |
| 18-64 years | 181,635 |
| 65+ years | 52,521 |
| Age Distribution (C 2022) | |
|---|---|
| 90+ years | 1,864 |
| 80-89 years | 10,295 |
| 70-79 years | 24,298 |
| 60-69 years | 33,875 |
| 50-59 years | 40,999 |
| 40-49 years | 45,861 |
| 30-39 years | 38,932 |
| 20-29 years | 30,379 |
| 10-19 years | 46,093 |
| 0-9 years | 41,480 |
| Country of Birth (C 2022) | |
|---|---|
| Ireland | 244,040 |
| Other country | 70,036 |
| Religion (C 2022) | |
|---|---|
| Catholics | 239,726 |
| Other Religion | 34,928 |
| No Religion | 24,775 |