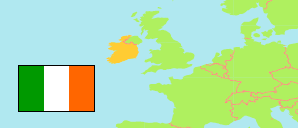
Munster
Province in Ireland
Contents: Subdivision
The population development in Munster as well as related information and services (Wikipedia, Google, images).
| Name | Status | Population Census 1981-04-05 | Population Census 1986-04-13 | Population Census 1991-04-21 | Population Census 1996-04-28 | Population Census 2002-04-28 | Population Census 2006-04-23 | Population Census 2011-04-10 | Population Census 2016-04-24 | Population Census 2022-04-03 | |
|---|---|---|---|---|---|---|---|---|---|---|---|
| Munster | Province | 998,315 | 1,020,577 | 1,009,533 | 1,033,903 | 1,100,614 | 1,173,340 | 1,246,088 | 1,280,020 | 1,373,346 | |
| Clare | County | 87,567 | 91,344 | 90,918 | 94,006 | 103,277 | 110,950 | 117,196 | 118,817 | 127,938 | → |
| Cork | County | ... | ... | ... | ... | ... | ... | 319,494 | 333,213 | 360,152 | → |
| Cork City | City | ... | ... | ... | ... | ... | ... | 199,538 | 209,655 | 224,004 | → |
| Kerry | County | 122,770 | 124,159 | 121,894 | 126,130 | 132,527 | 139,835 | 145,502 | 147,707 | 156,458 | → |
| Limerick | City and County | 161,661 | 164,569 | 161,956 | 165,042 | 175,304 | 184,055 | 191,809 | 194,899 | 209,536 | → |
| Tipperary | County | 135,261 | 136,619 | 132,772 | 133,535 | 140,131 | 149,244 | 158,754 | 159,553 | 167,895 | → |
| Waterford | City and County | 88,591 | 91,151 | 91,624 | 94,680 | 101,546 | 107,961 | 113,795 | 116,176 | 127,363 | → |
| Ireland (Éire) | Republic | 3,443,405 | 3,540,643 | 3,525,719 | 3,626,087 | 3,917,203 | 4,239,848 | 4,588,252 | 4,761,865 | 5,149,139 |
Source: Central Statistics Office, Ireland.
Further information about the population structure:
| Gender (C 2022) | |
|---|---|
| Males | 680,335 |
| Females | 693,011 |
| Age Groups (C 2022) | |
|---|---|
| 0-17 years | 320,227 |
| 18-64 years | 828,458 |
| 65+ years | 224,661 |
| Age Distribution (C 2022) | |
|---|---|
| 90+ years | 7,859 |
| 80-89 years | 44,023 |
| 70-79 years | 104,280 |
| 60-69 years | 146,220 |
| 50-59 years | 178,841 |
| 40-49 years | 206,543 |
| 30-39 years | 178,142 |
| 20-29 years | 152,403 |
| 10-19 years | 189,042 |
| 0-9 years | 165,993 |
| Country of Birth (C 2022) | |
|---|---|
| Ireland | 1,126,549 |
| Other country | 246,797 |
| Religion (C 2022) | |
|---|---|
| Catholic | 1,002,293 |
| Other Religion | 103,369 |
| No Religion | 181,274 |